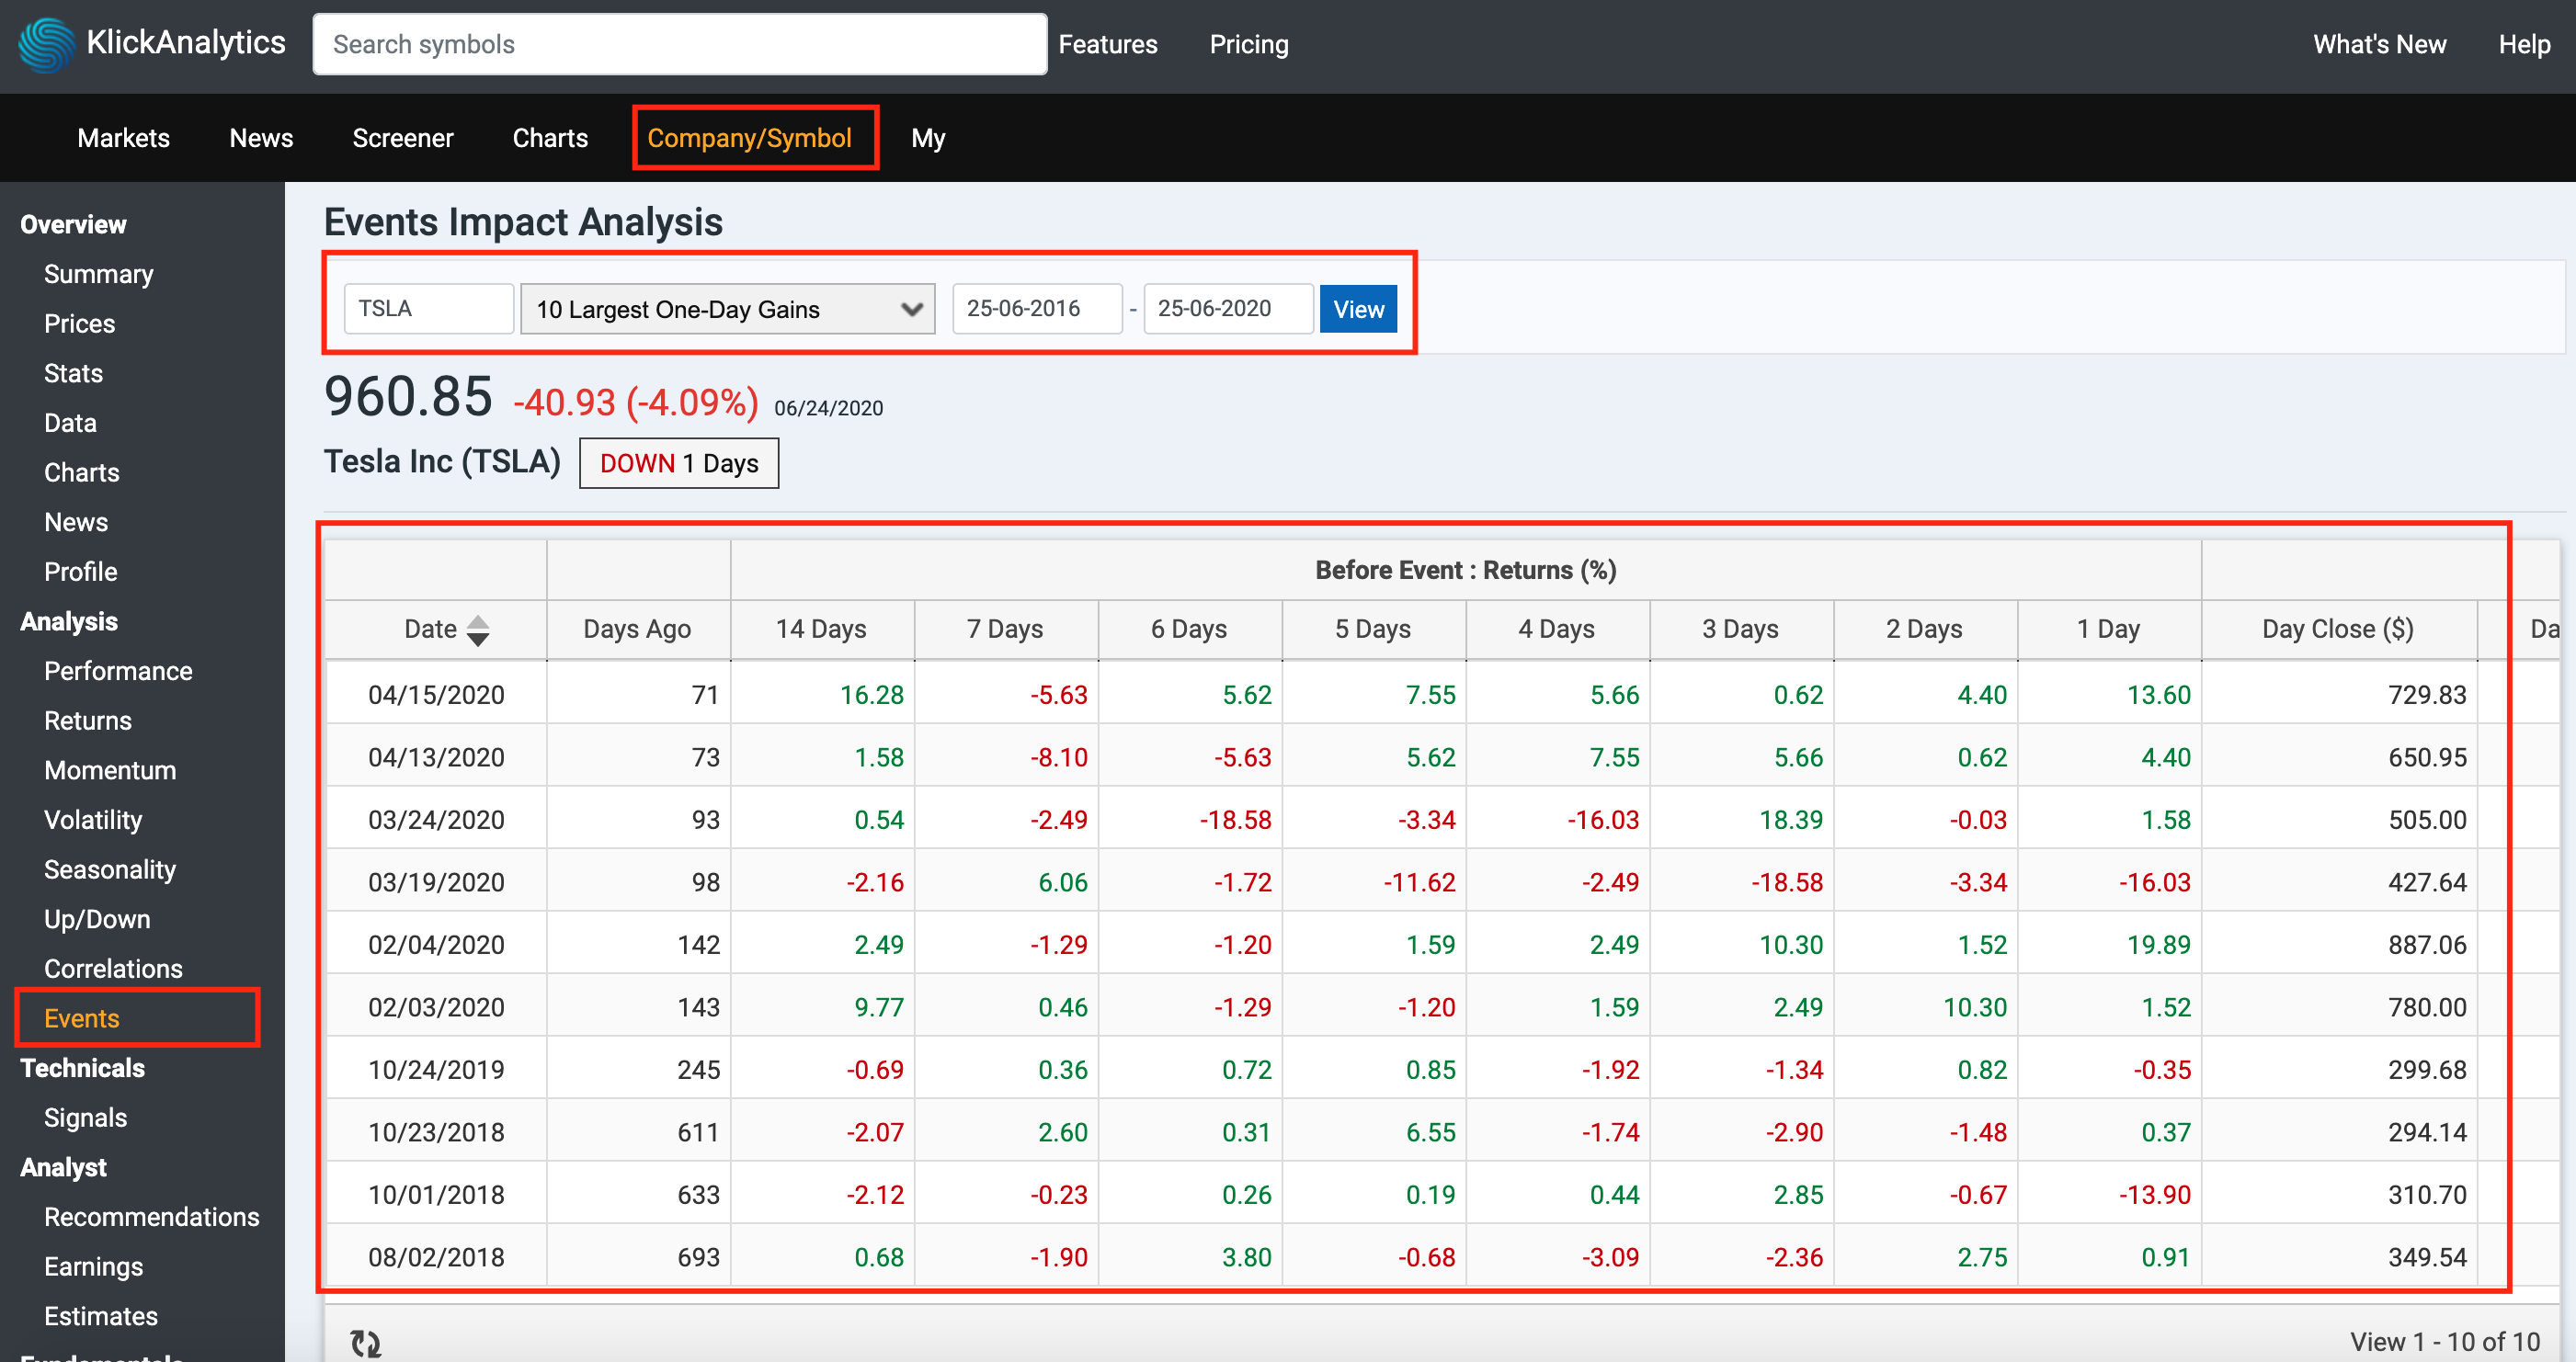
Our new Event-Driven app enables our users to see how stock prices have historically been impacted by different events in the market. We analyze data based on your selected date range and market event and then show the results in a table format that shows average results along with the number of negative and positive occurrences for each date event. This will allow a user to see the price trend patterns and much more.

To access: Search for a symbol say TSLA, and then from the left symbol menu, click on Event

