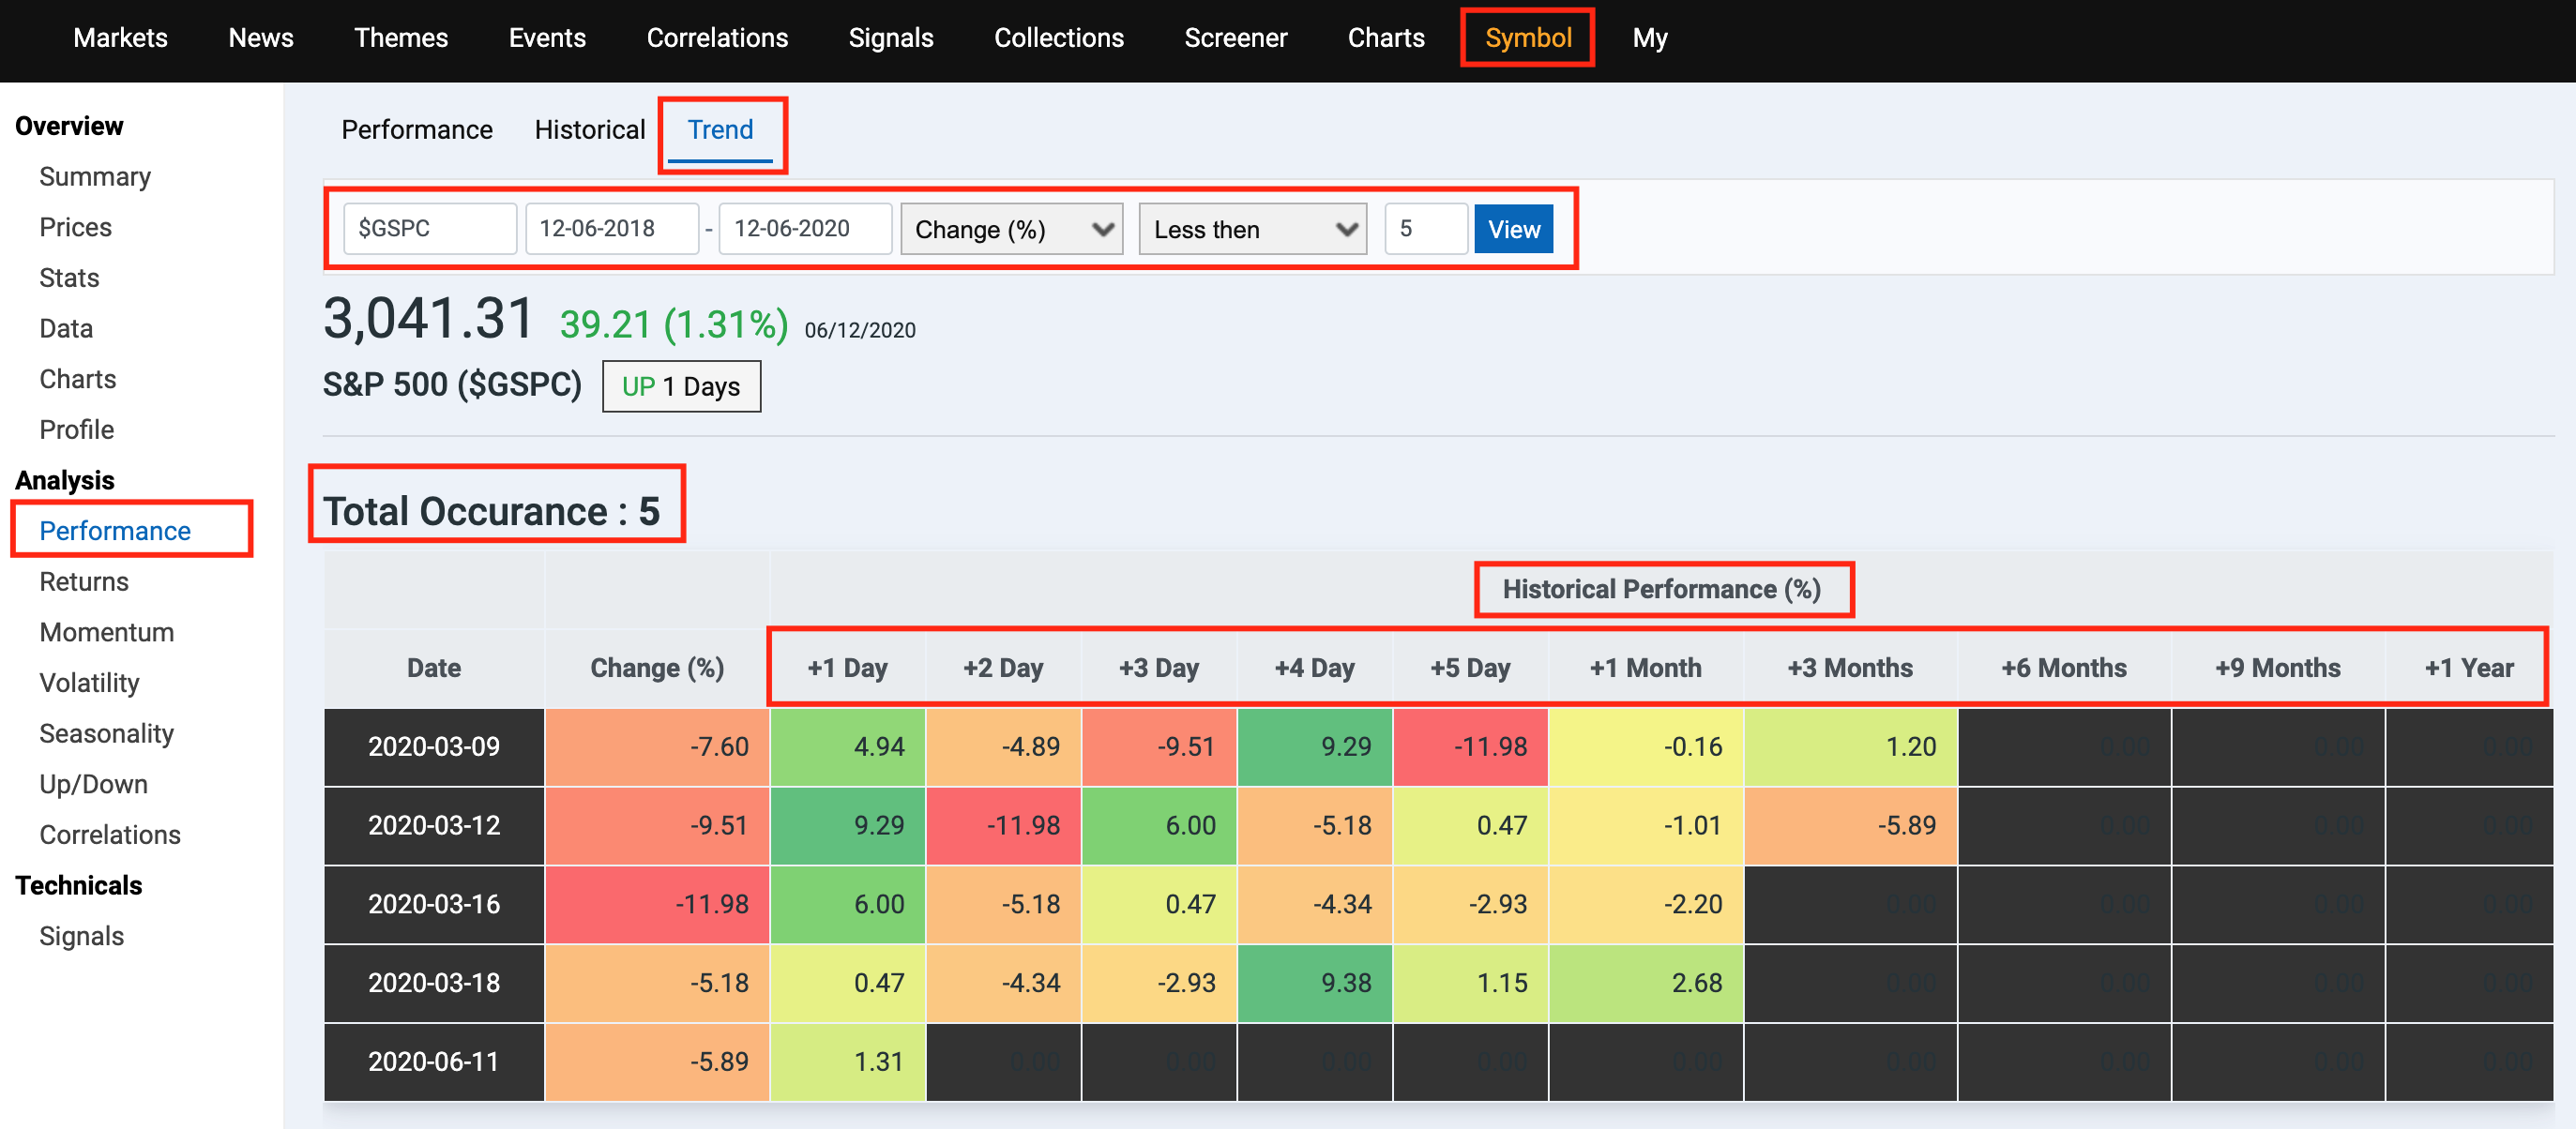
It is important to see how a symbol performed right after a decline or rise. To do such an analysis, we've added a new app called Performance Trend. Our user can run queries like show me S&P500 performance after 5% declines and more. i.e.,;
View the historical performance of any global symbol
Ability to define the date range
Ability to set a numerical value like Change (%) less than 5 %
Display total occurrence based on user filter criteria
Display Change (%) performance on the;
day of the event
After 1 Day
After 2 Days
After 3 Days
After 4 Days
After 5 Days
After 1 Month
After 3 Months
After 6 Months
After 9 Months
After 1 Year

To access: Search for a symbol say $GSPC, and from the left symbol menu, click on Performance > Trend

