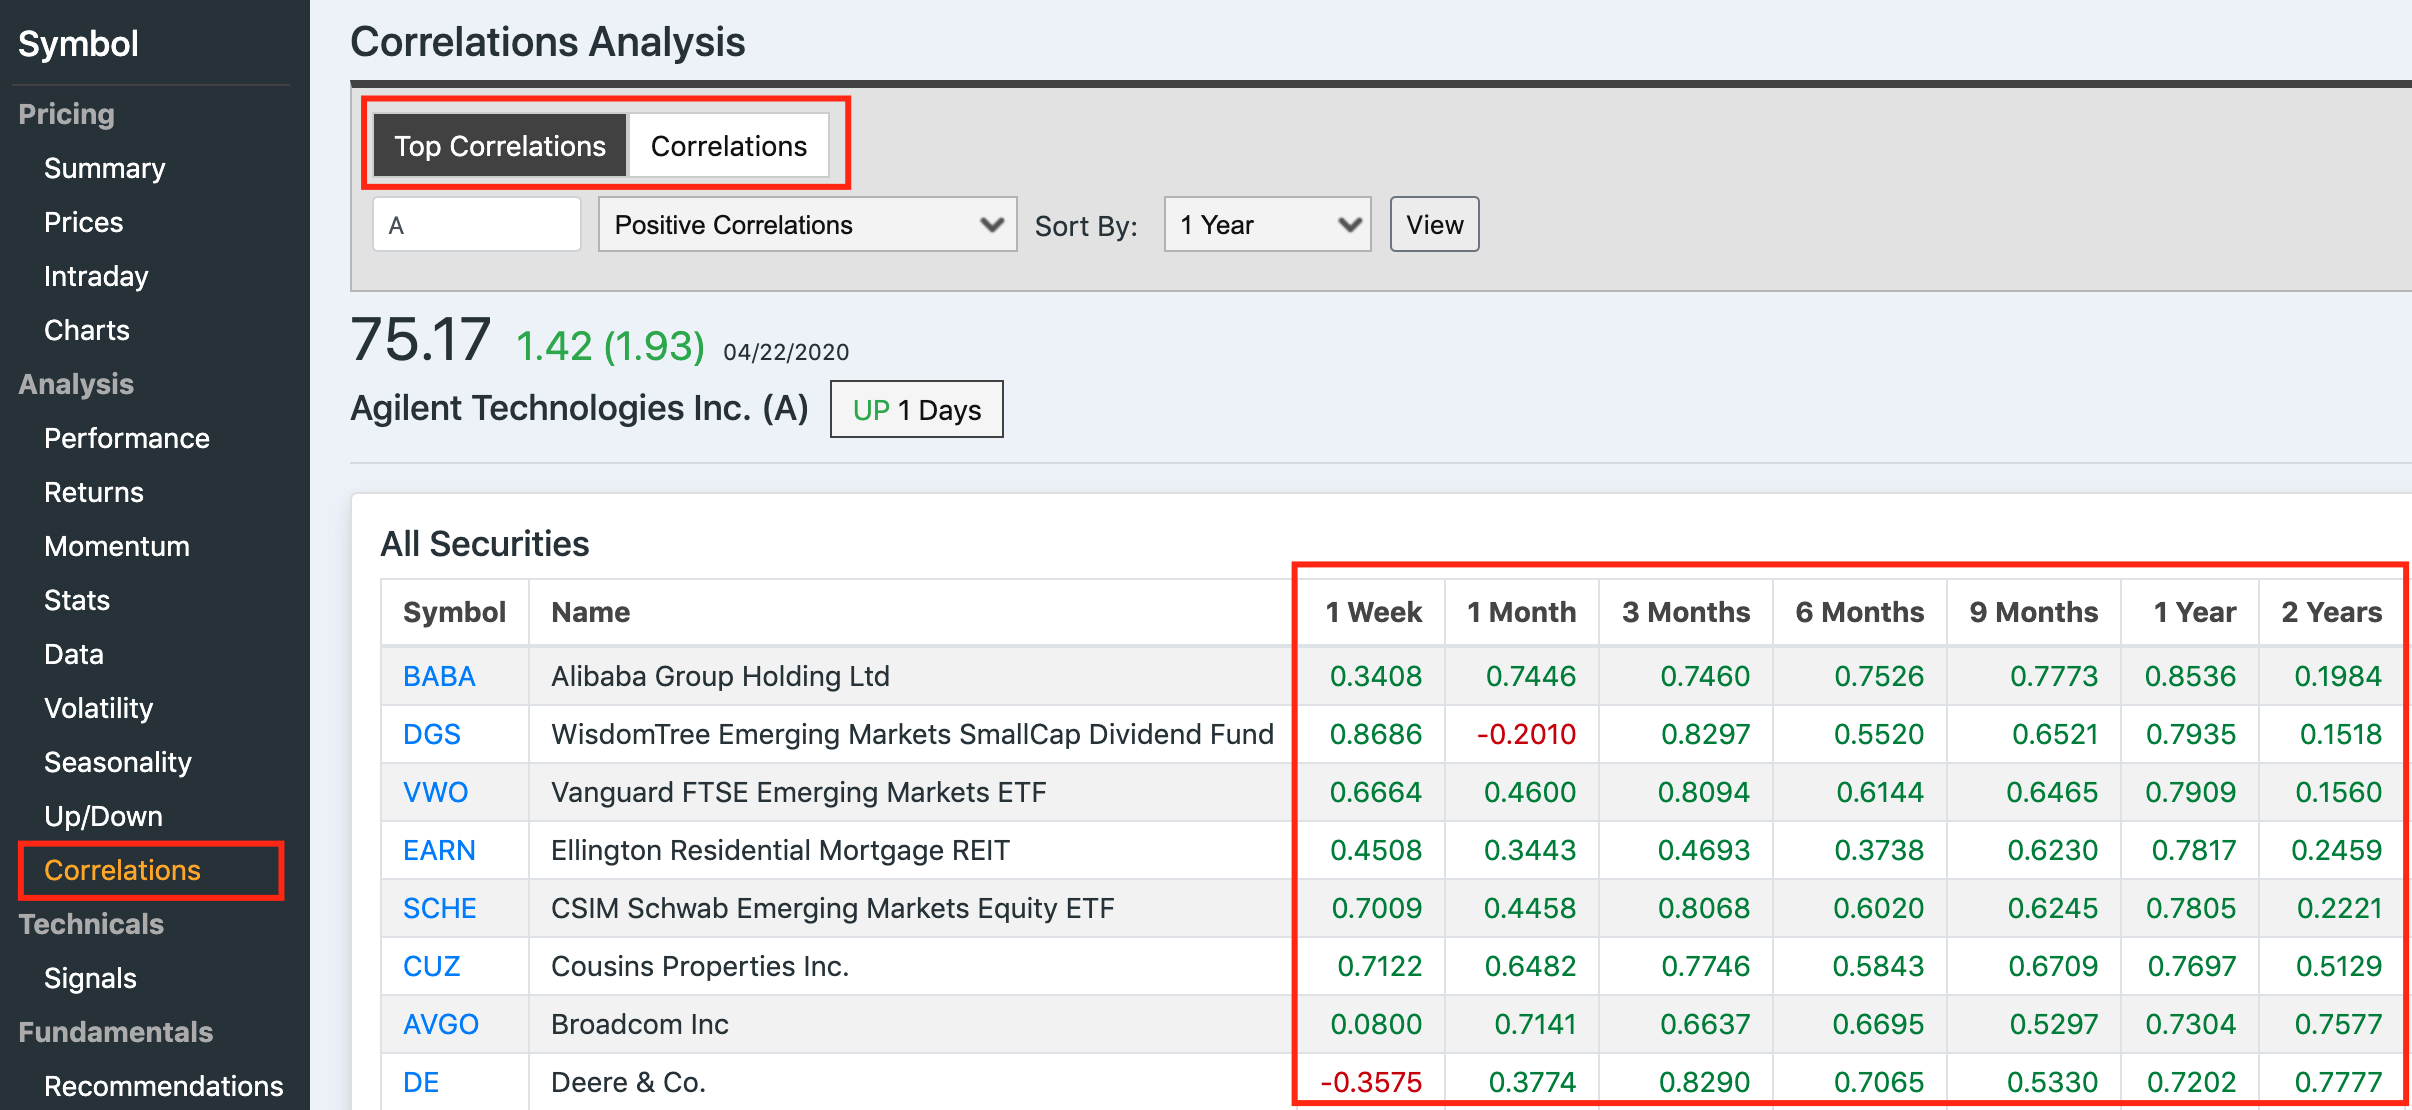
Users currently do use manual methods to calculate correlations, one by one within instruments. This is to view trend analysis to optimize pair trading, or hedging, and other trading opportunities. To solve this problem, KlickAnalytics runs and calculates more than 25+ million daily correlations among global instruments on a daily basis with an automated process. We have taken 5000+ global instruments spanning across following asset classes;
Indices
Stocks
ETFs
Currency
Crypto
Commodities
Major Economic Indicators
and others
This will allow our users to quickly see the correlation among various above asset classes. We calculate the following period calculations for correlations;
1 Week
1 Month
3 Months
6 Months
9 Months
1 Years
2 Years
3 Years
4 Years
5 Years

To access: Search for any global stocks, say A and then click on Correlations from the symbol left menu.

