It is import to know how a stock is performance historically to uncover its price patterns and more. To do that, we've added a new app called Backtest. The Backtest Strategy app allows you to;
Backtest investment strategies based on various technical Indicators
You can analyze any Stocks, ETFs, Crypto currency and more
Filters

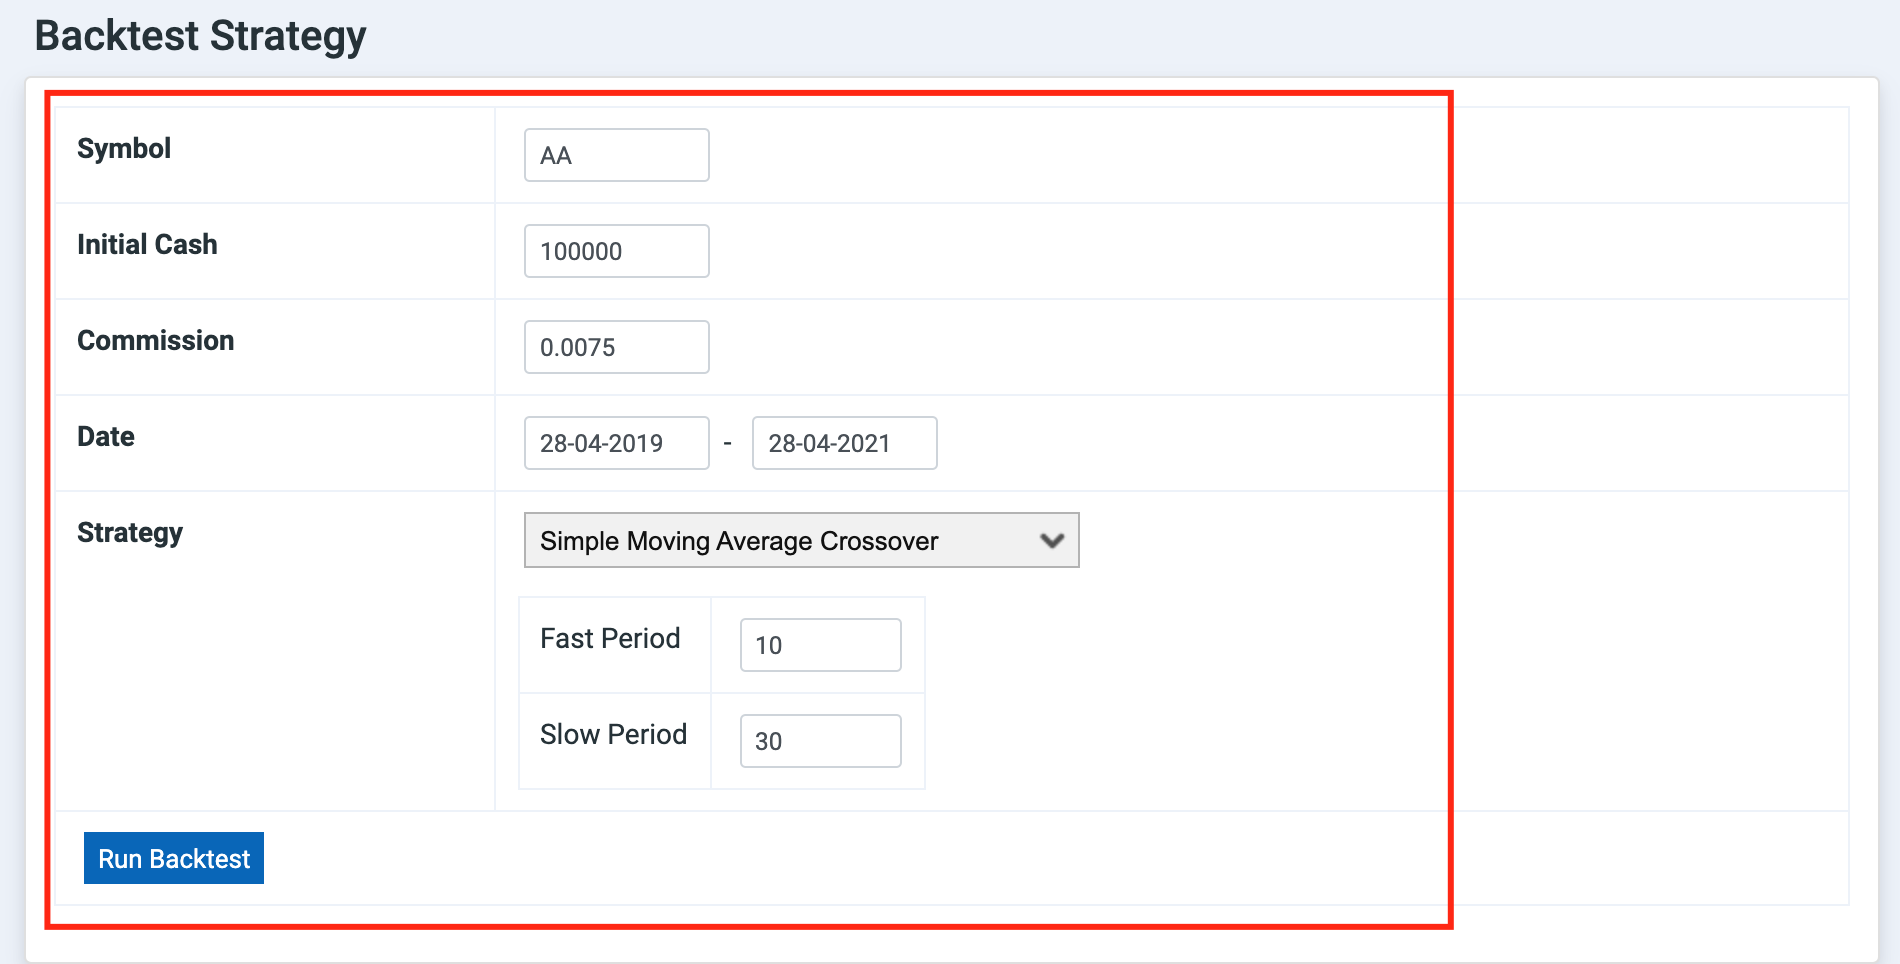
To analyze a strategy, you can use the following filters
Symbol : Set a global symbol e.g AA, TSLA, DOGE-COIN etc.
Set Initial Cash as investment
Commission per trade
Trading Date range - from and to
Following strategies are available to play around
Simple Moving Average Crossover
Exponential Moving Average Crossover
MACD
RSI
Bollinger Bands
You can change various input parameters for the strategies to compute various results sets and analyze them accordingly.
Strategy Output
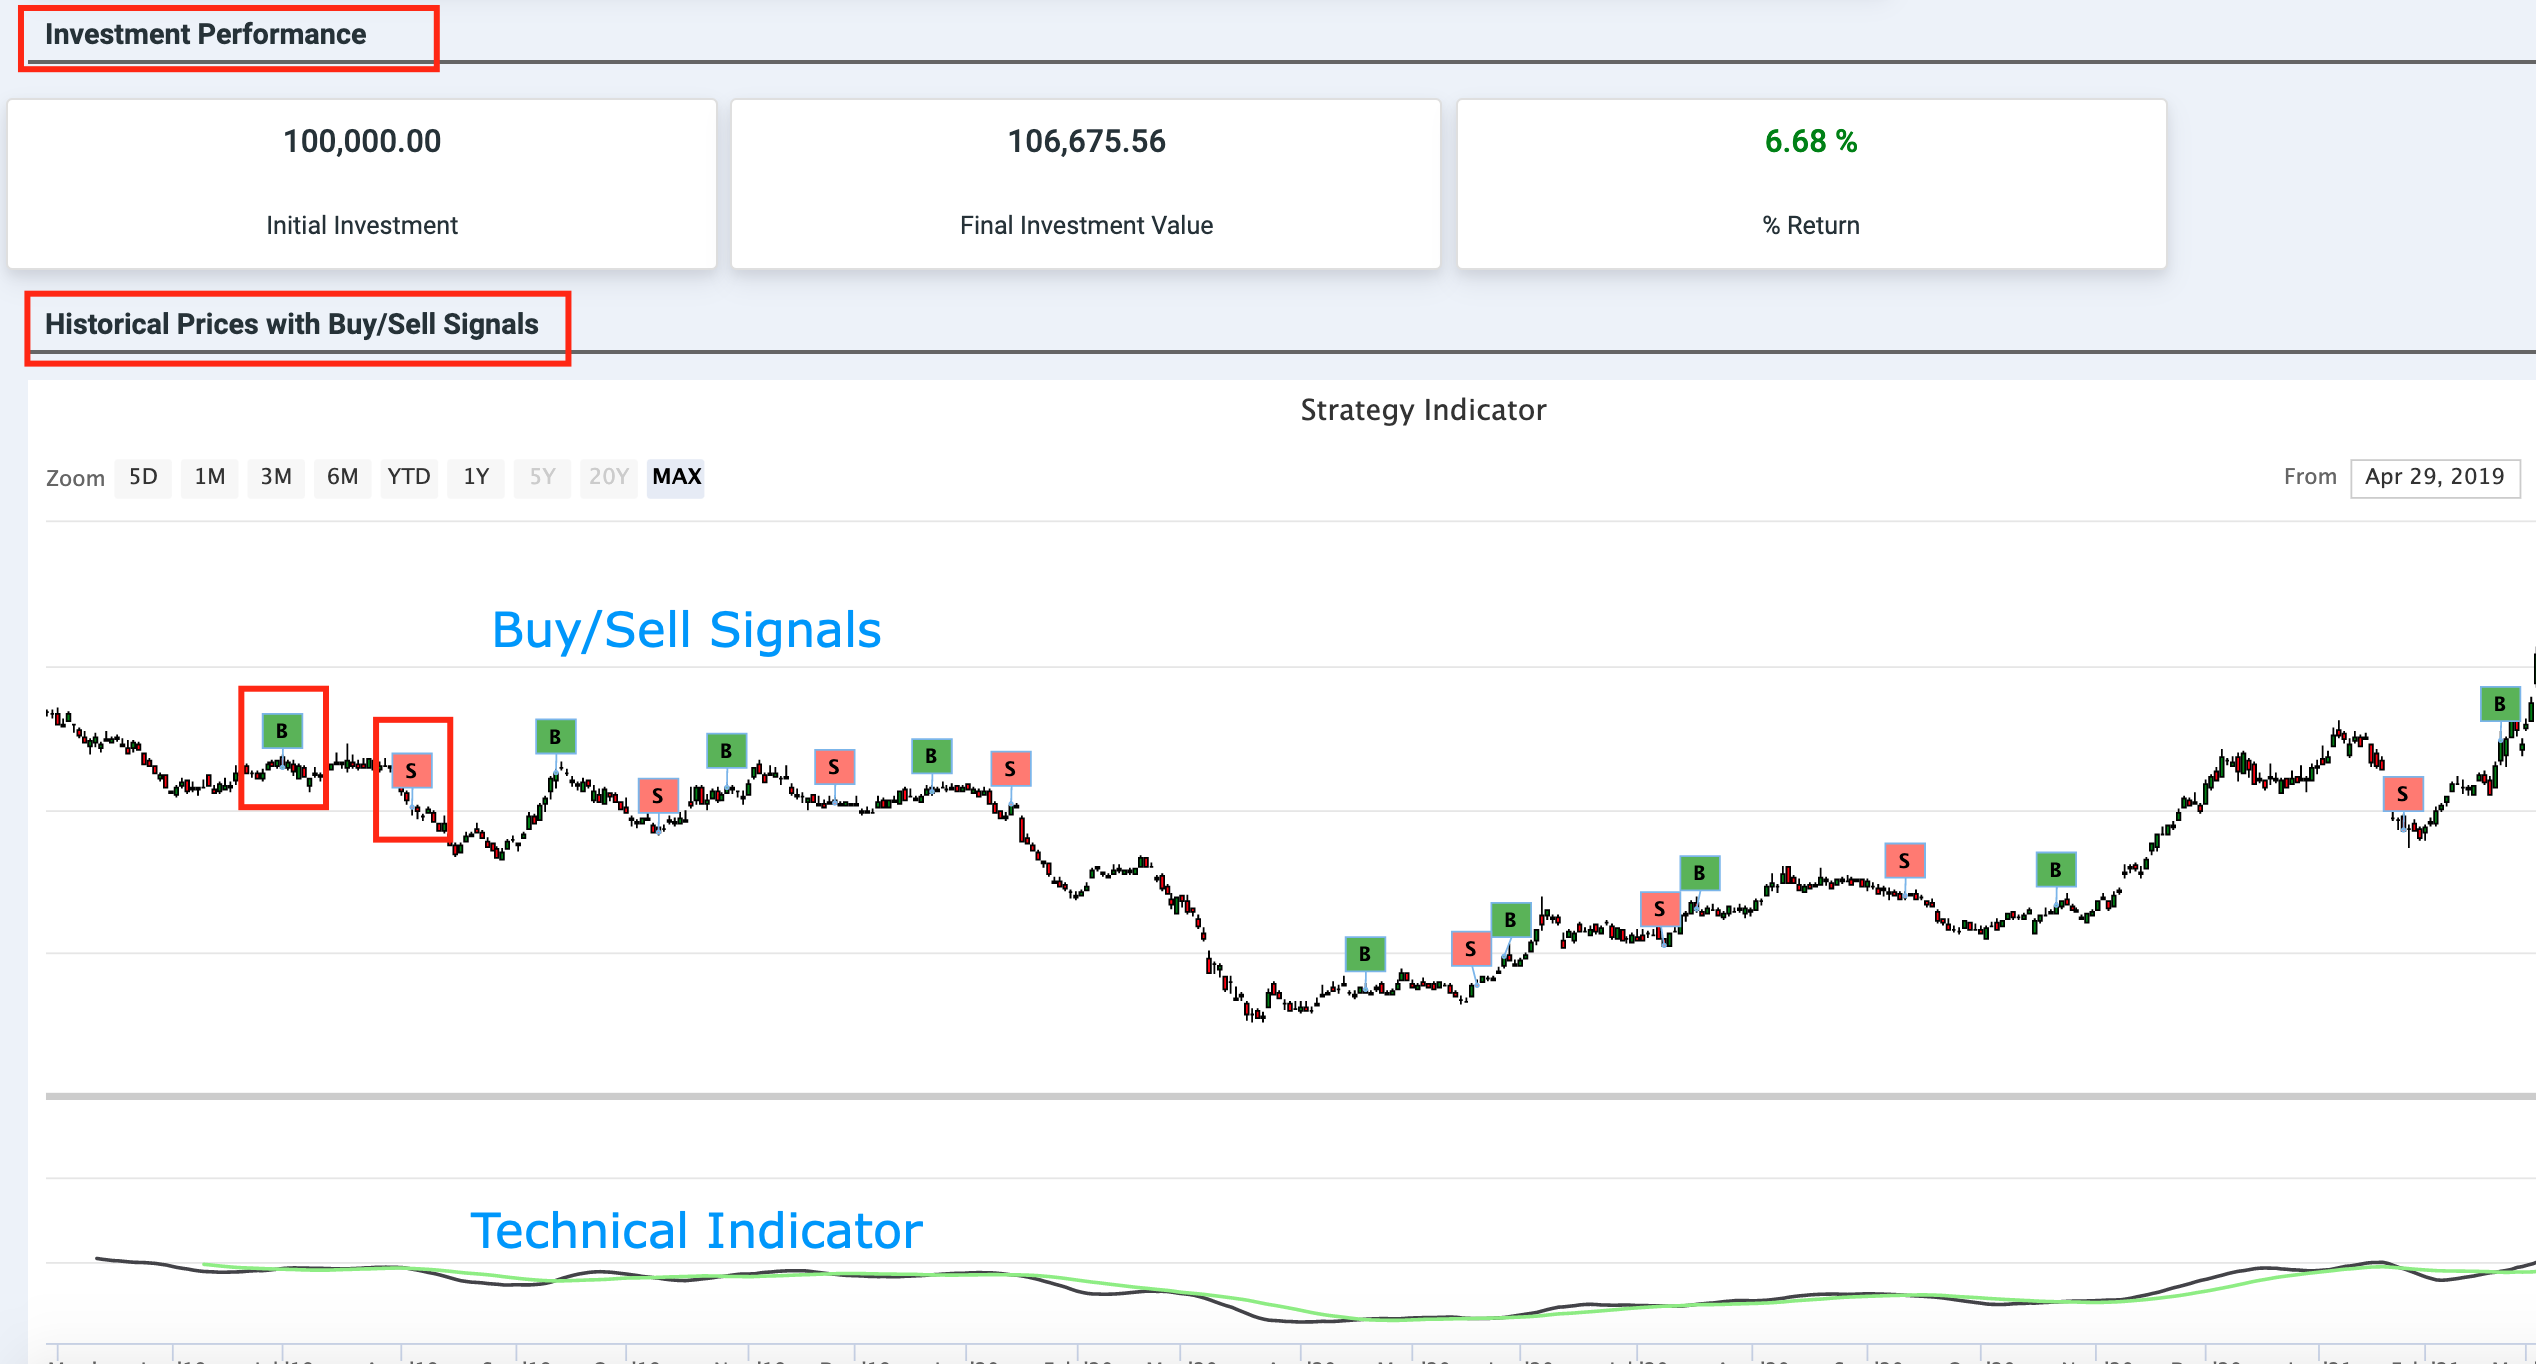
Once you select the strategy of your choice and hit 'Run Backtest', our system will compute the following
Quick investment performance data with
Initial Investment
Final Investment value
% Change of investment
Historical chart with Buy/Sell signals indicators, to help you to quickly visualize the trades
Corresponding technical indicator is plotted on the historical chart so that you can compare, zoom in/out to see when a particular buy or sell signal is generated.

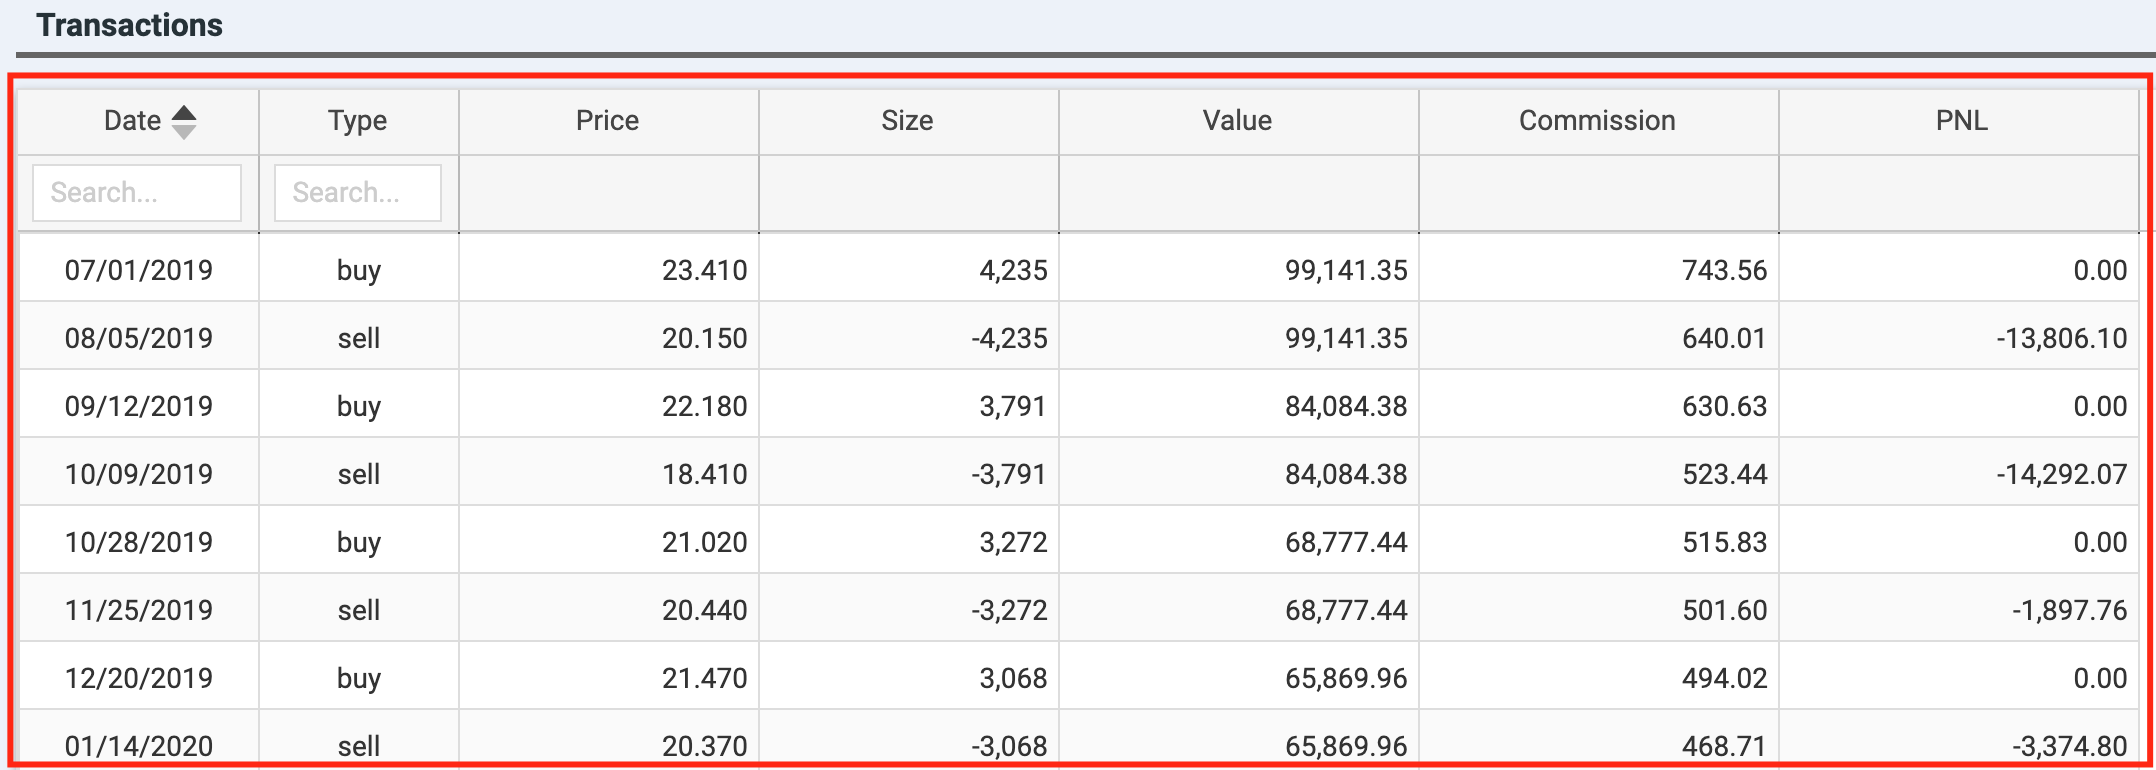
A Transactions data table is displayed to enlist all possible Buy/Sell signals found by the selected strategy with the following data items
Date
Type (Buy or Sell)
Price
Size
Transaction Value
Any commission for the trade
Profit and Loss

Run backtest strategy tool with different strategies to see the overall investment performance to look for investment opportunities and more.
To access: From the top menu bar, click on Menu > Backtest

