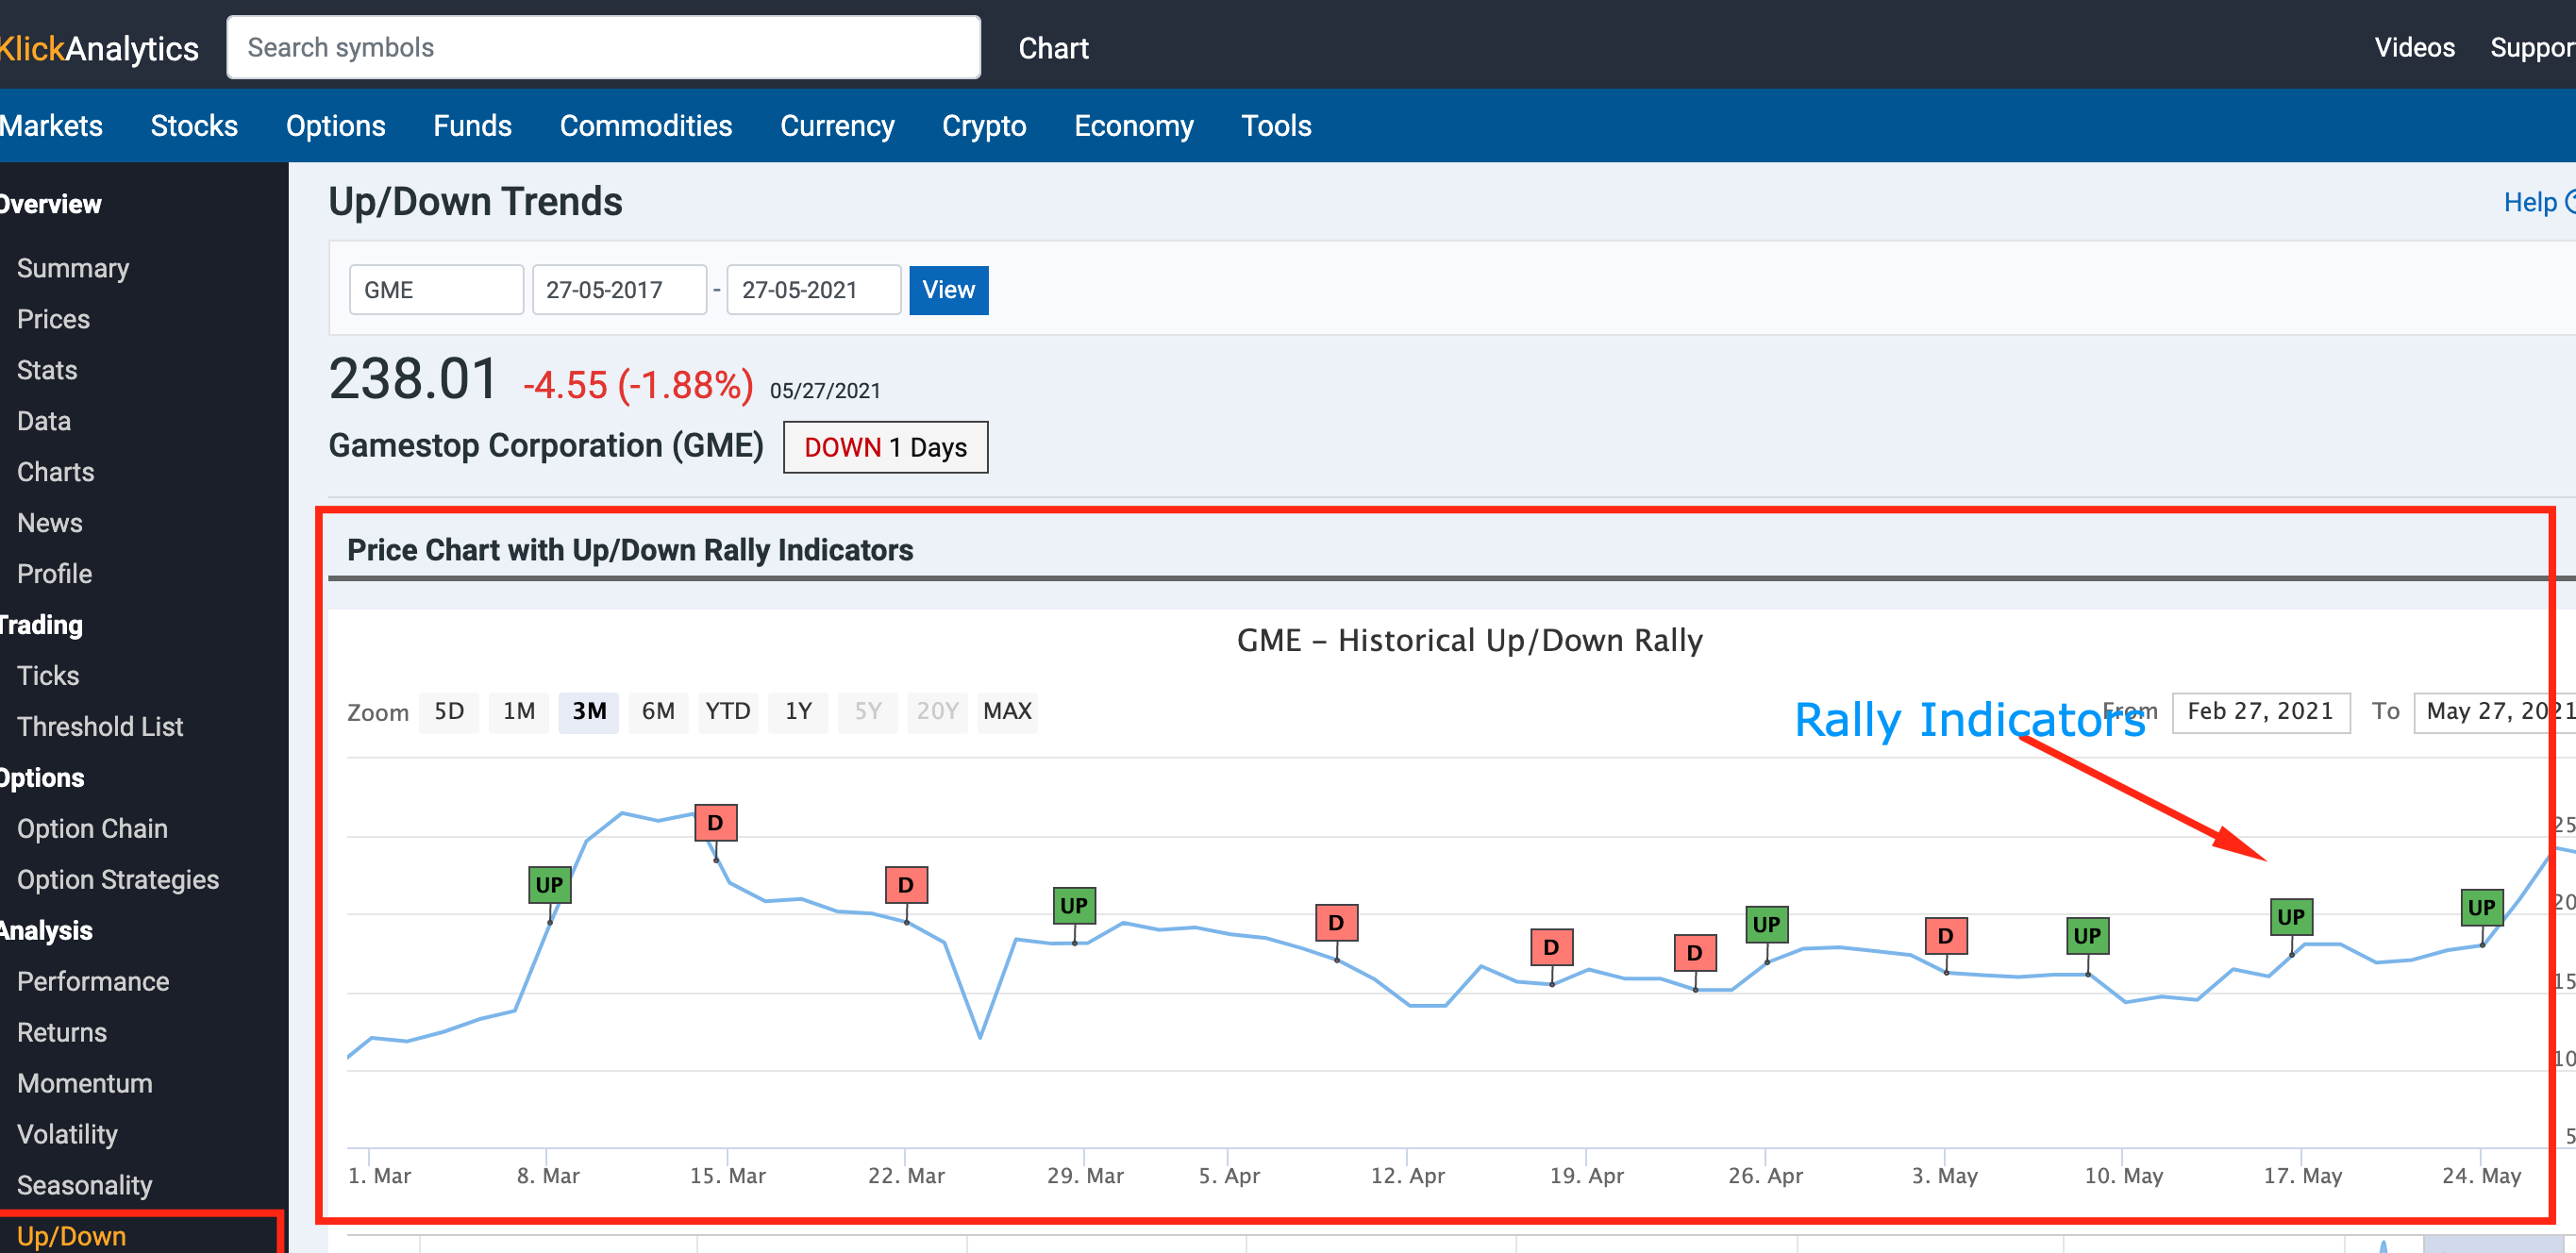
We've enhanced our symbol up/down app with the following;
Historical Up/Down Rally Days Indicators
Now you can view all the historical up/down consecutive rally days on the chart. This will allow our users to quickly view the rally days where the instrument is continuously UP/DOWN or had No Change in price.

When click on an rally indicator flag, it will show you the following information;
Price Direction
From Date
Days it is UP/DOWN or No Change
First Price
Last Price
Returns (%) during the rally
Highest Rally Day
Will show you the highest rally day where the instrument was UP. Also indicate how many days the highest rally event occurred too.
Total Up/Down or No Change Days
Also, we added the total counts for all UP/DOWN or No Change Rally days, so that you can see how many days an instrument is UP/Down or had No Change in price for consecutive days.
Historical Up/Down Data Grid
The data table display the following information too;
Day of the Week
Price Direction i.e. UP/DOWN or NO Change
From Date
Days i.e. How many consecutive days the instrument is either UP/DOWN or had No Change in price
First Price of the rally start date
Last Price of the rally end date
Returns (%) i.e. The returns % within the rally days.
To access: Search for any global symbol say GME, and then from the left symbol menu, click on Up/Down.


