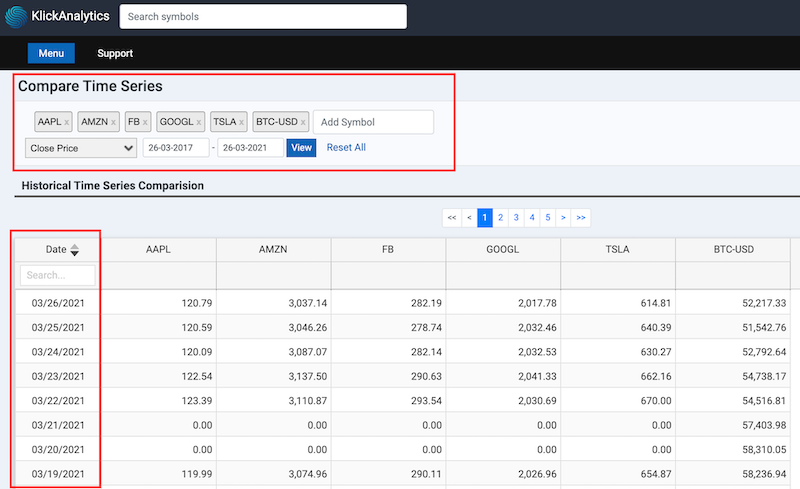
Time Series analysis is essential when looking at multiple instruments. To provide such analysis, we've added a new app called 'TimeSeries'. The TimeSeries app will provide;
Allows you to view a side-by-side comparison of any global stock, ETF, or any other symbol.
You can compare up to 15 symbols together.
When the page is first displayed, you will see five symbols already pre-loaded on the comparison page.
You may add or remove symbols.
You can chose financial metrics like Pricing data to compare e.g.
Open Price
High Price
Low Price
Close Price
Volume
1 Day Change ($)
1 Day Change (%)
The app display a table with date align in descending order and the financial metric value is added on the columns for each selected instrument. In this way, the data is align for all symbols by trade date and you can compare financial metrics side by side for further analysis and more.

To access: From the top menu, click on Menu > TimeSeries

