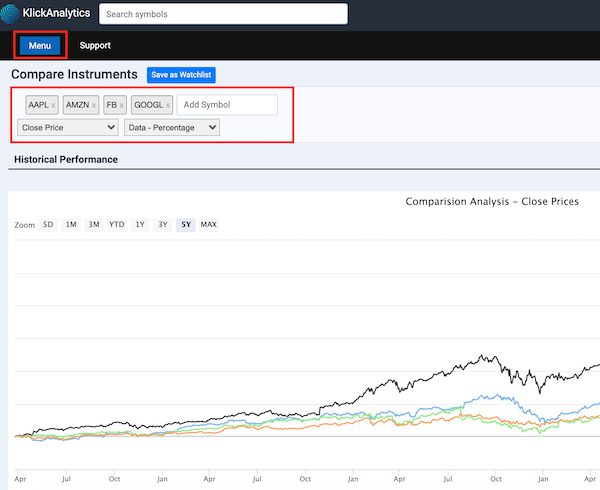
The Compare Instrument app allows you to view a side-by-side comparison of any global stock, ETF, or any other symbol.
You can compare up to 15 symbols together.
When the page is first displayed, you will see five symbols already pre-loaded on the comparison page.
You may add or remove symbols.
The compare app shows
Historical Comparison Chart
Compare instruments Open/High/Low/Close/Volume/1 Day Change($) or 1 Day Change (%)
Ability to compare based on actual vs percentage values on chart
Historical Stats Summary Table
List Pricing Information
Technical Data
Valuations Data
Earnings / Dividends Data
You can also save the symbols into a watchlist by clicking on 'Save to Watchlist' button.

To access: From the top click on Menu > Compare

