
We've updated our Summary app with the following enhancements;
On the chart showing at summary app, you can now view the chart in the following formats.
Line
Area
OHLC
Candlestick
Spline
Area Spline
Area Range
Area Spline Range
In addition, you can quickly apply the following technical indicators on the interactive chart too
Simple Moving Average (14 Days)
Simple Moving Average (50 Days)
Simple Moving Average (100 Days)
Simple Moving Average (200 Days)
Exponential Moving Average (50 Days)
Exponential Moving Average (200 Days)
Simple Moving Average 20 vs 50 days
Simple Moving Average 50 vs 200 days
MACD
RSI
Bollinger Bands
Pivot Points
Linear Regressions
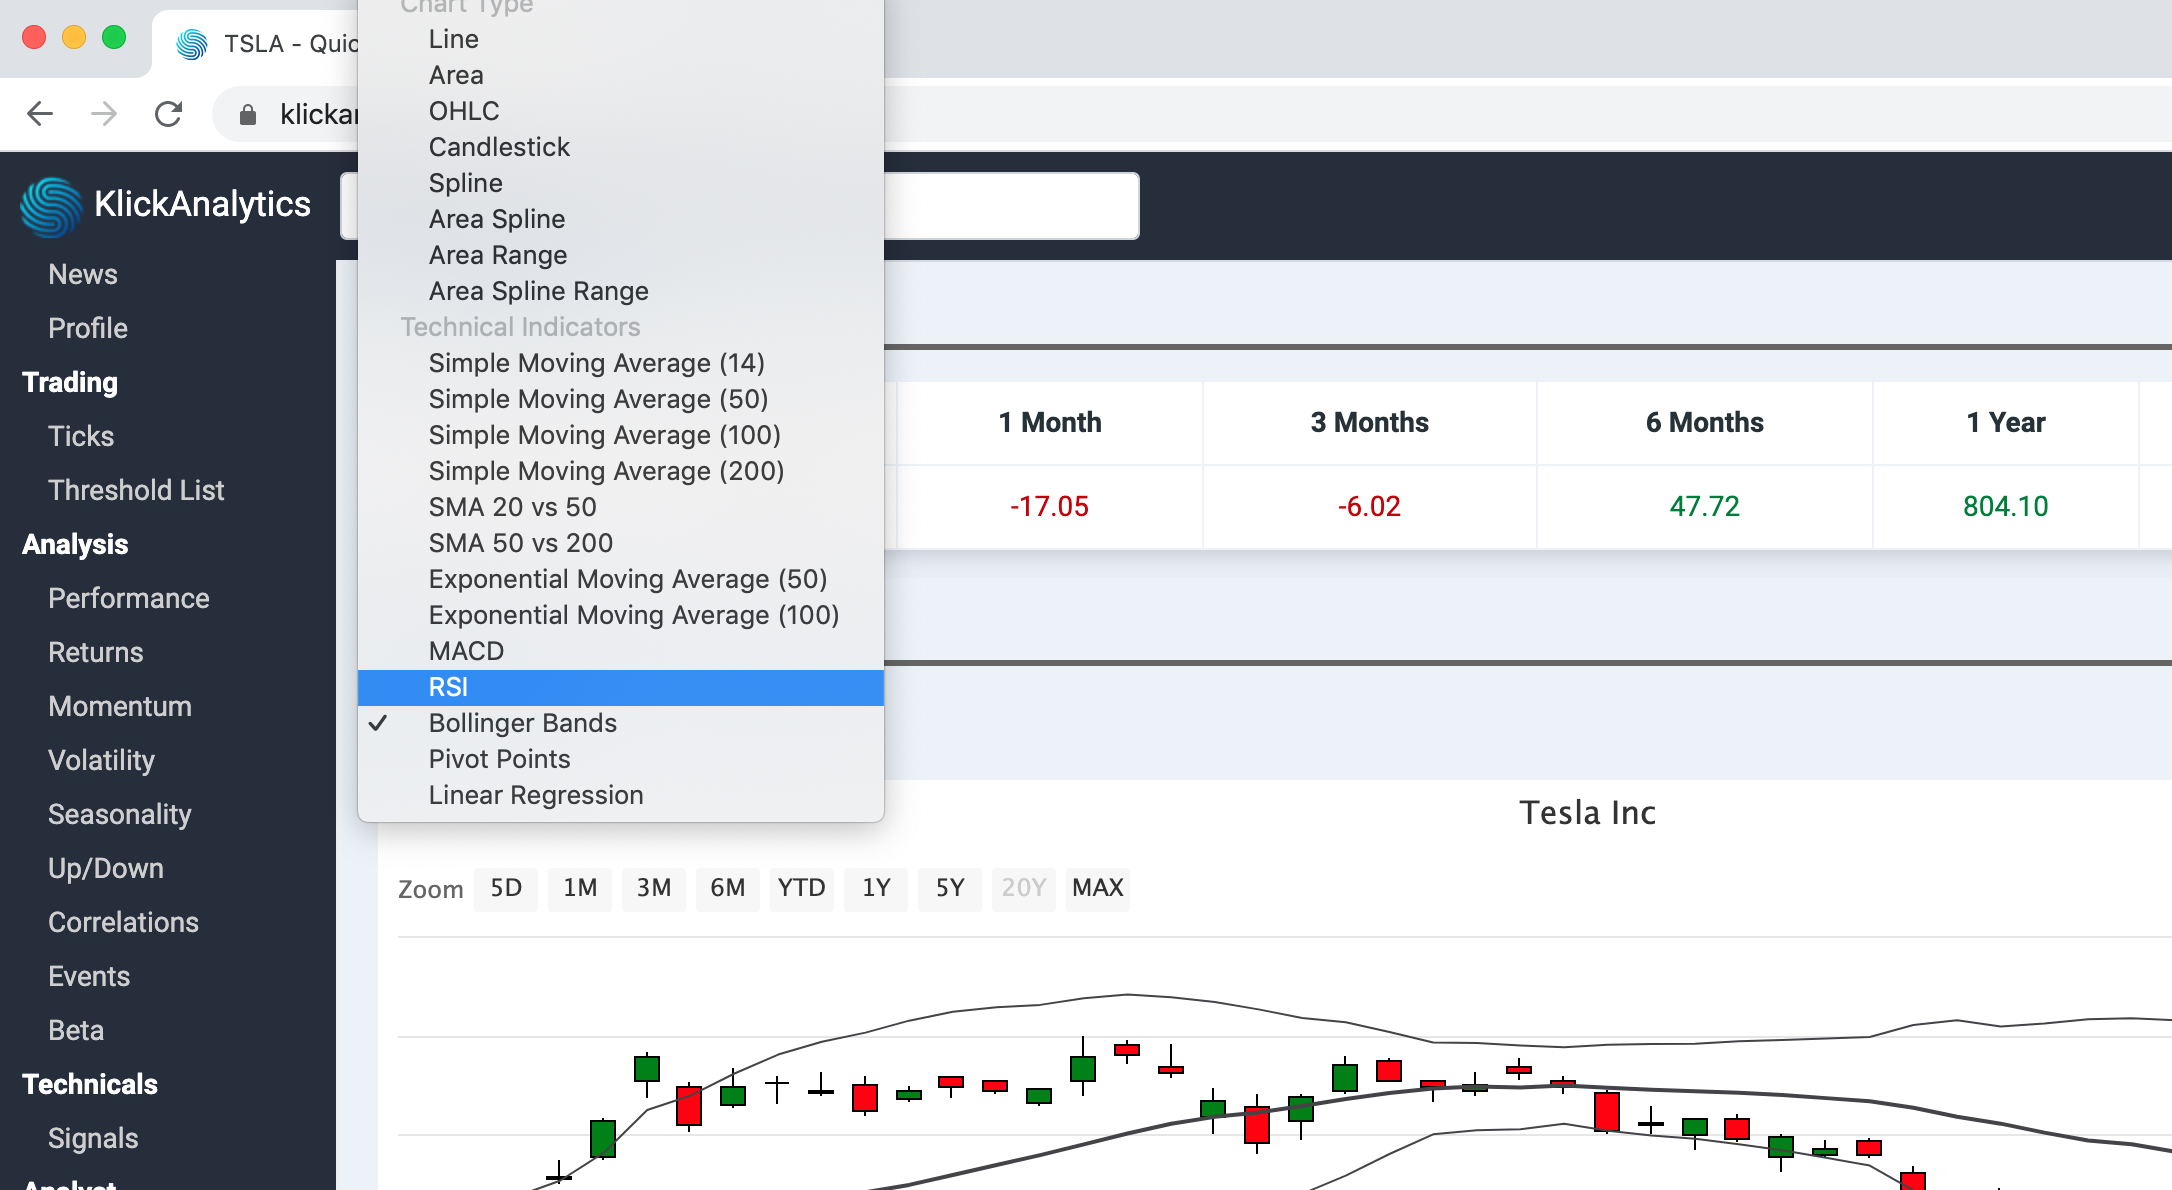
To access: Search for any global symbol, say TSLA and then from the left symbol menu, select Summary