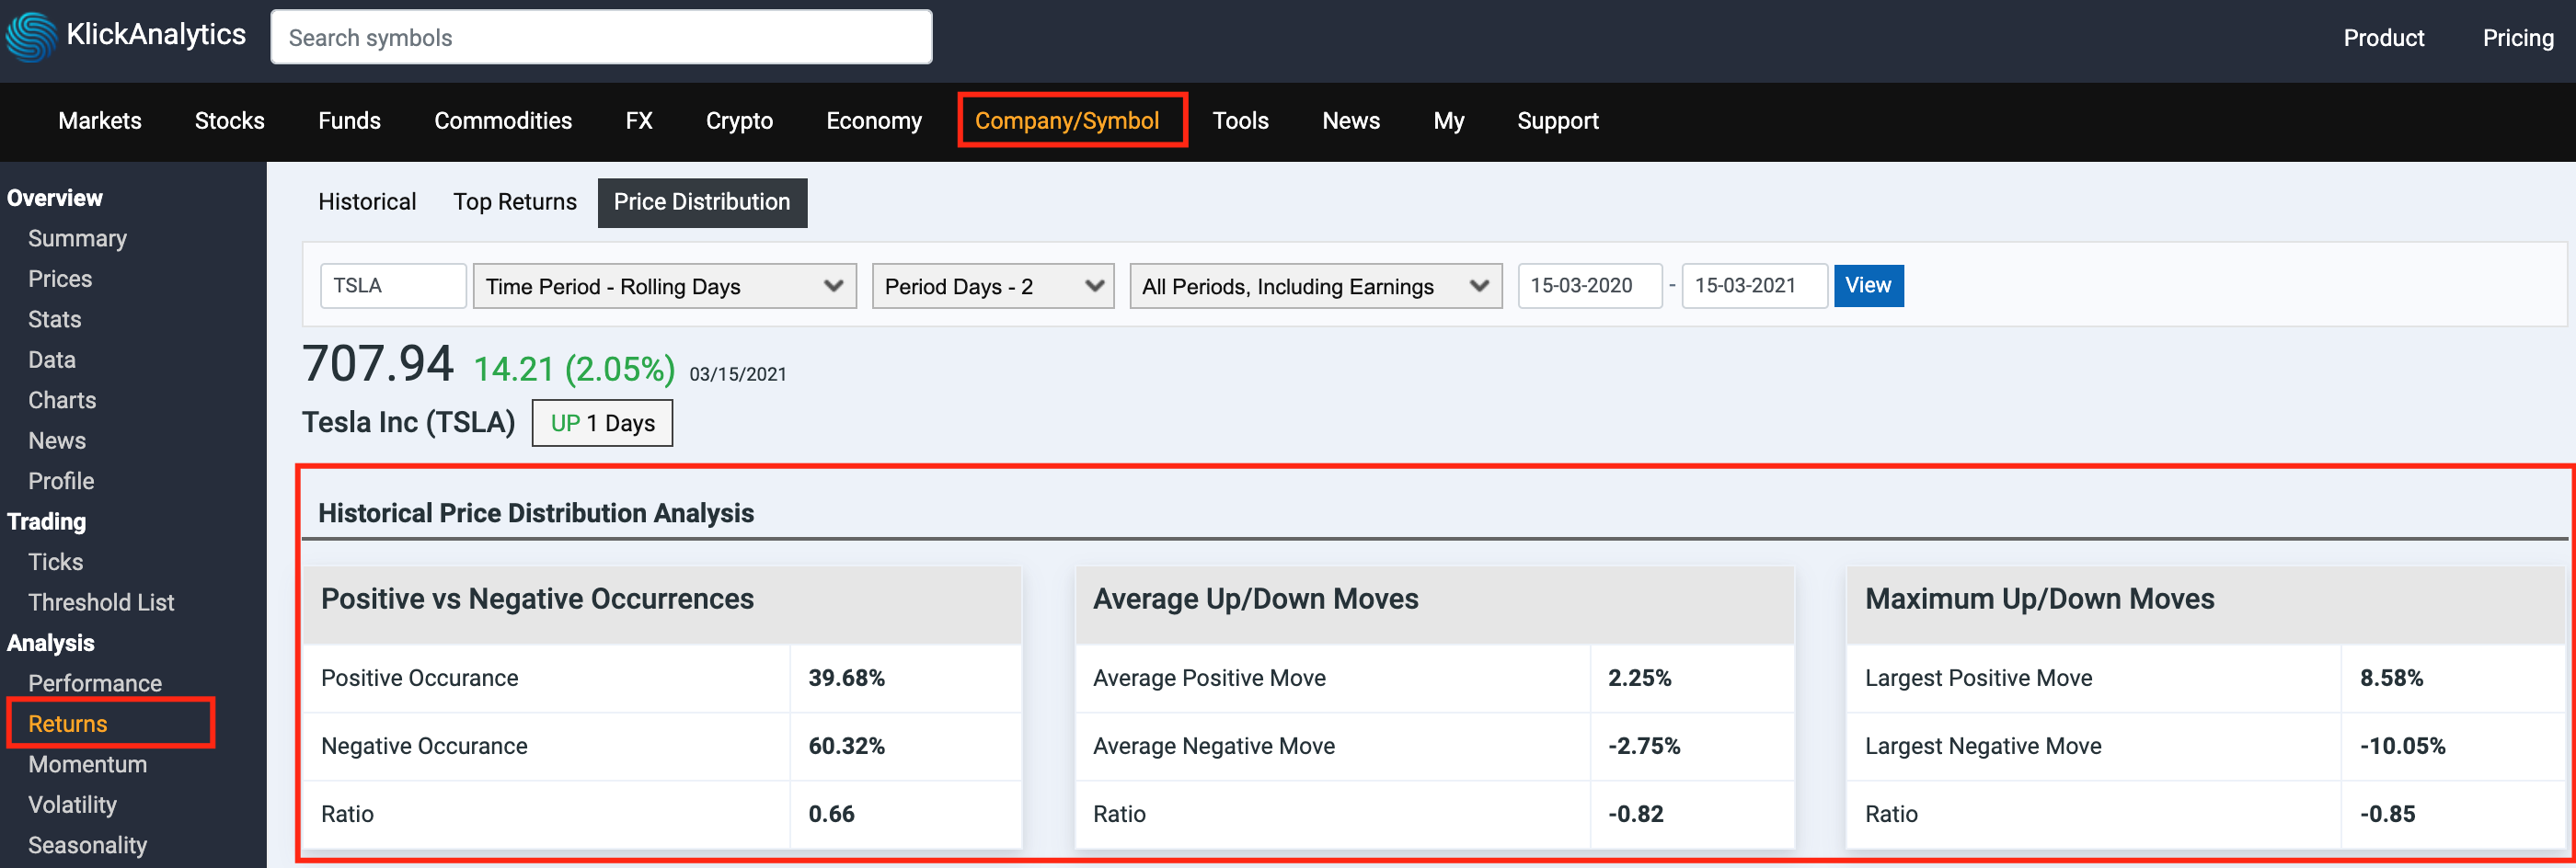
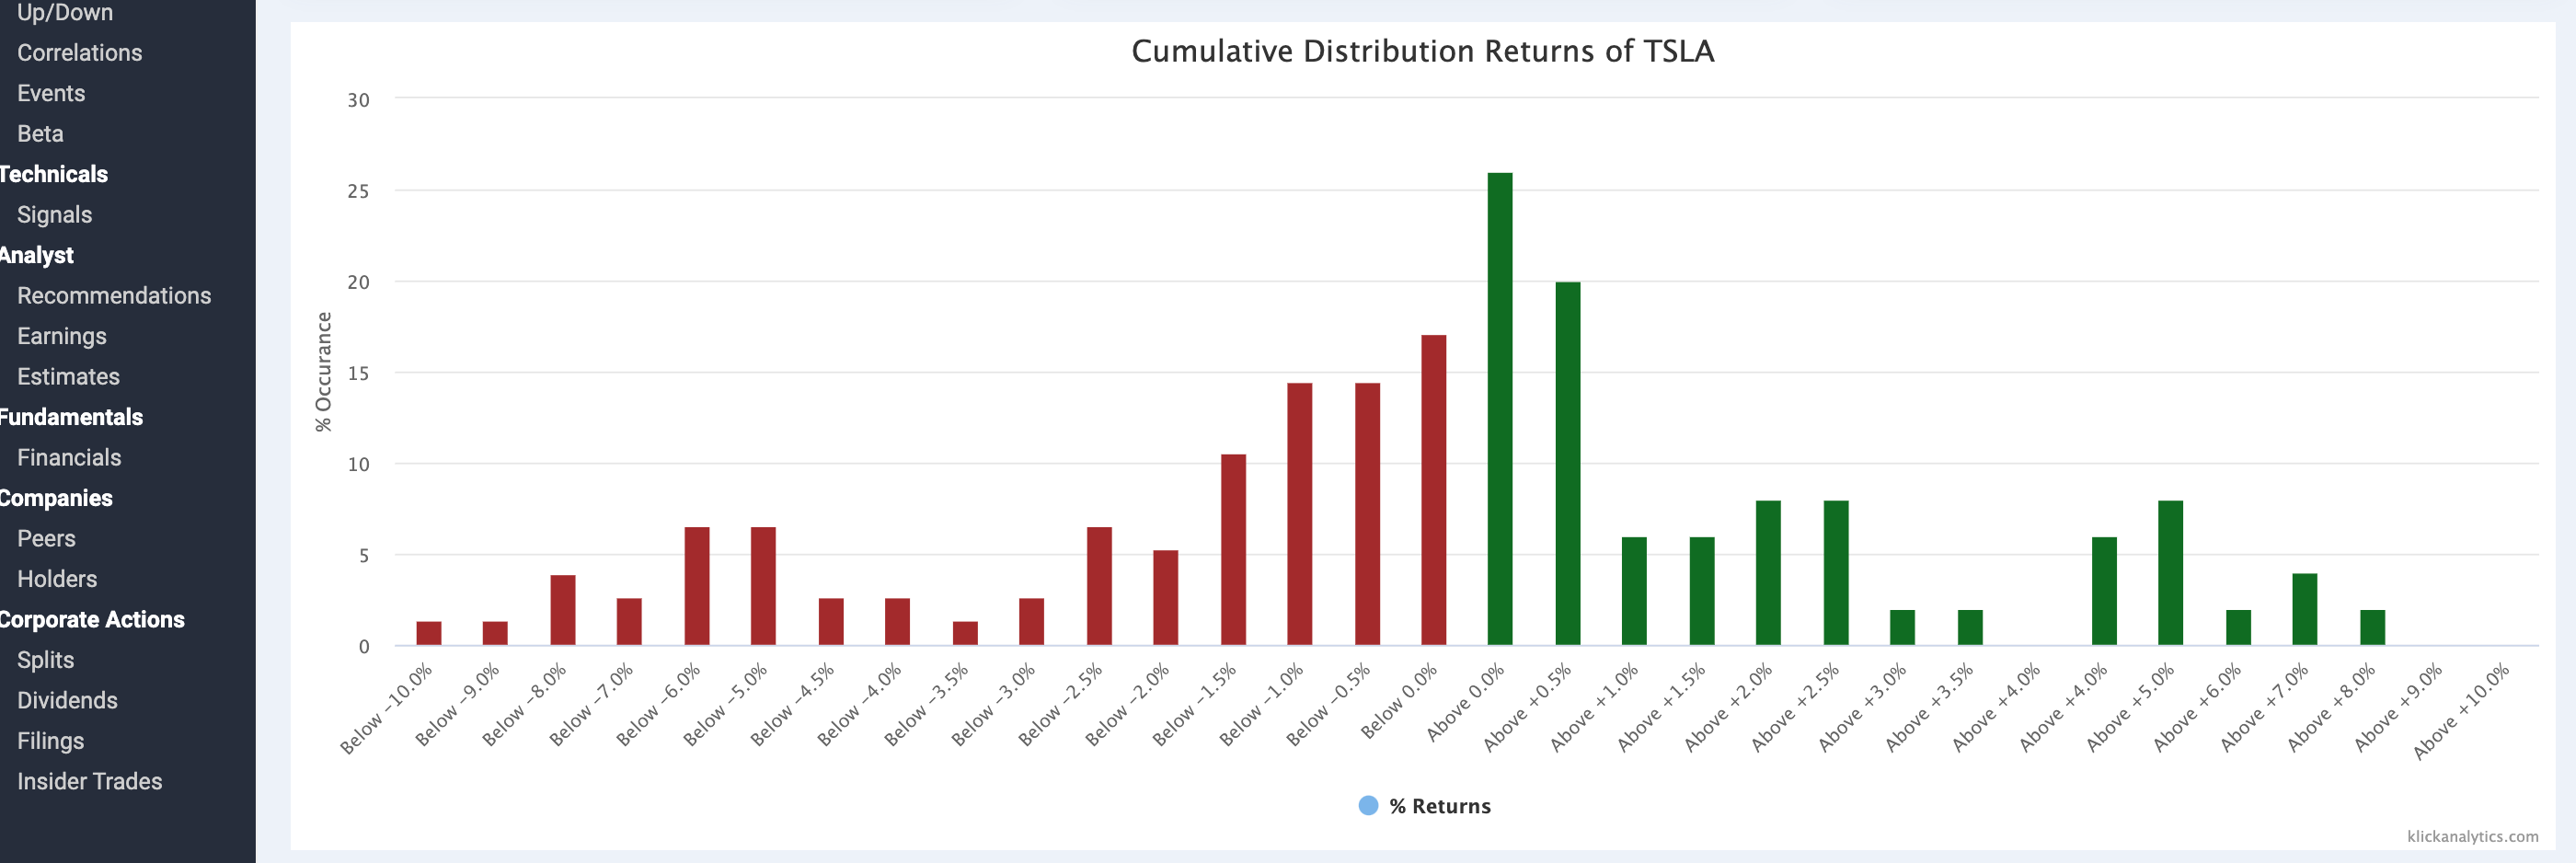
It is important to examine the historical price movements to identify potential patterns and trends like extreme price movements, positive/negative returns, ratios and more. We've added a new app Price Distribution to do the same. This app will help you;
View historical price returns distribution patterns on any given global symbol e.g. Stock, ETFs, Currency, Commodities and more.
Ability to select your time period
Weekly (calculate the returns from week-to-week i.e. Friday to Friday)
Monthly (calculate the returns on the first business day to the last business day of the month)
Intervals (take the date range selected, and split data into intervals consist of # of days entered (with no-overlap)
Rolling days (calculate the moving average returns based on the # of days entered)
Ability to select earnings data periods
All earnings periods dates
Exclude all earnings periods date
Only take earnings periods dates
Ability to select your own custom date range for analysis


To access: Search for a symbol like TSLA, and then from the left menu, select Returns > Price Distribution

