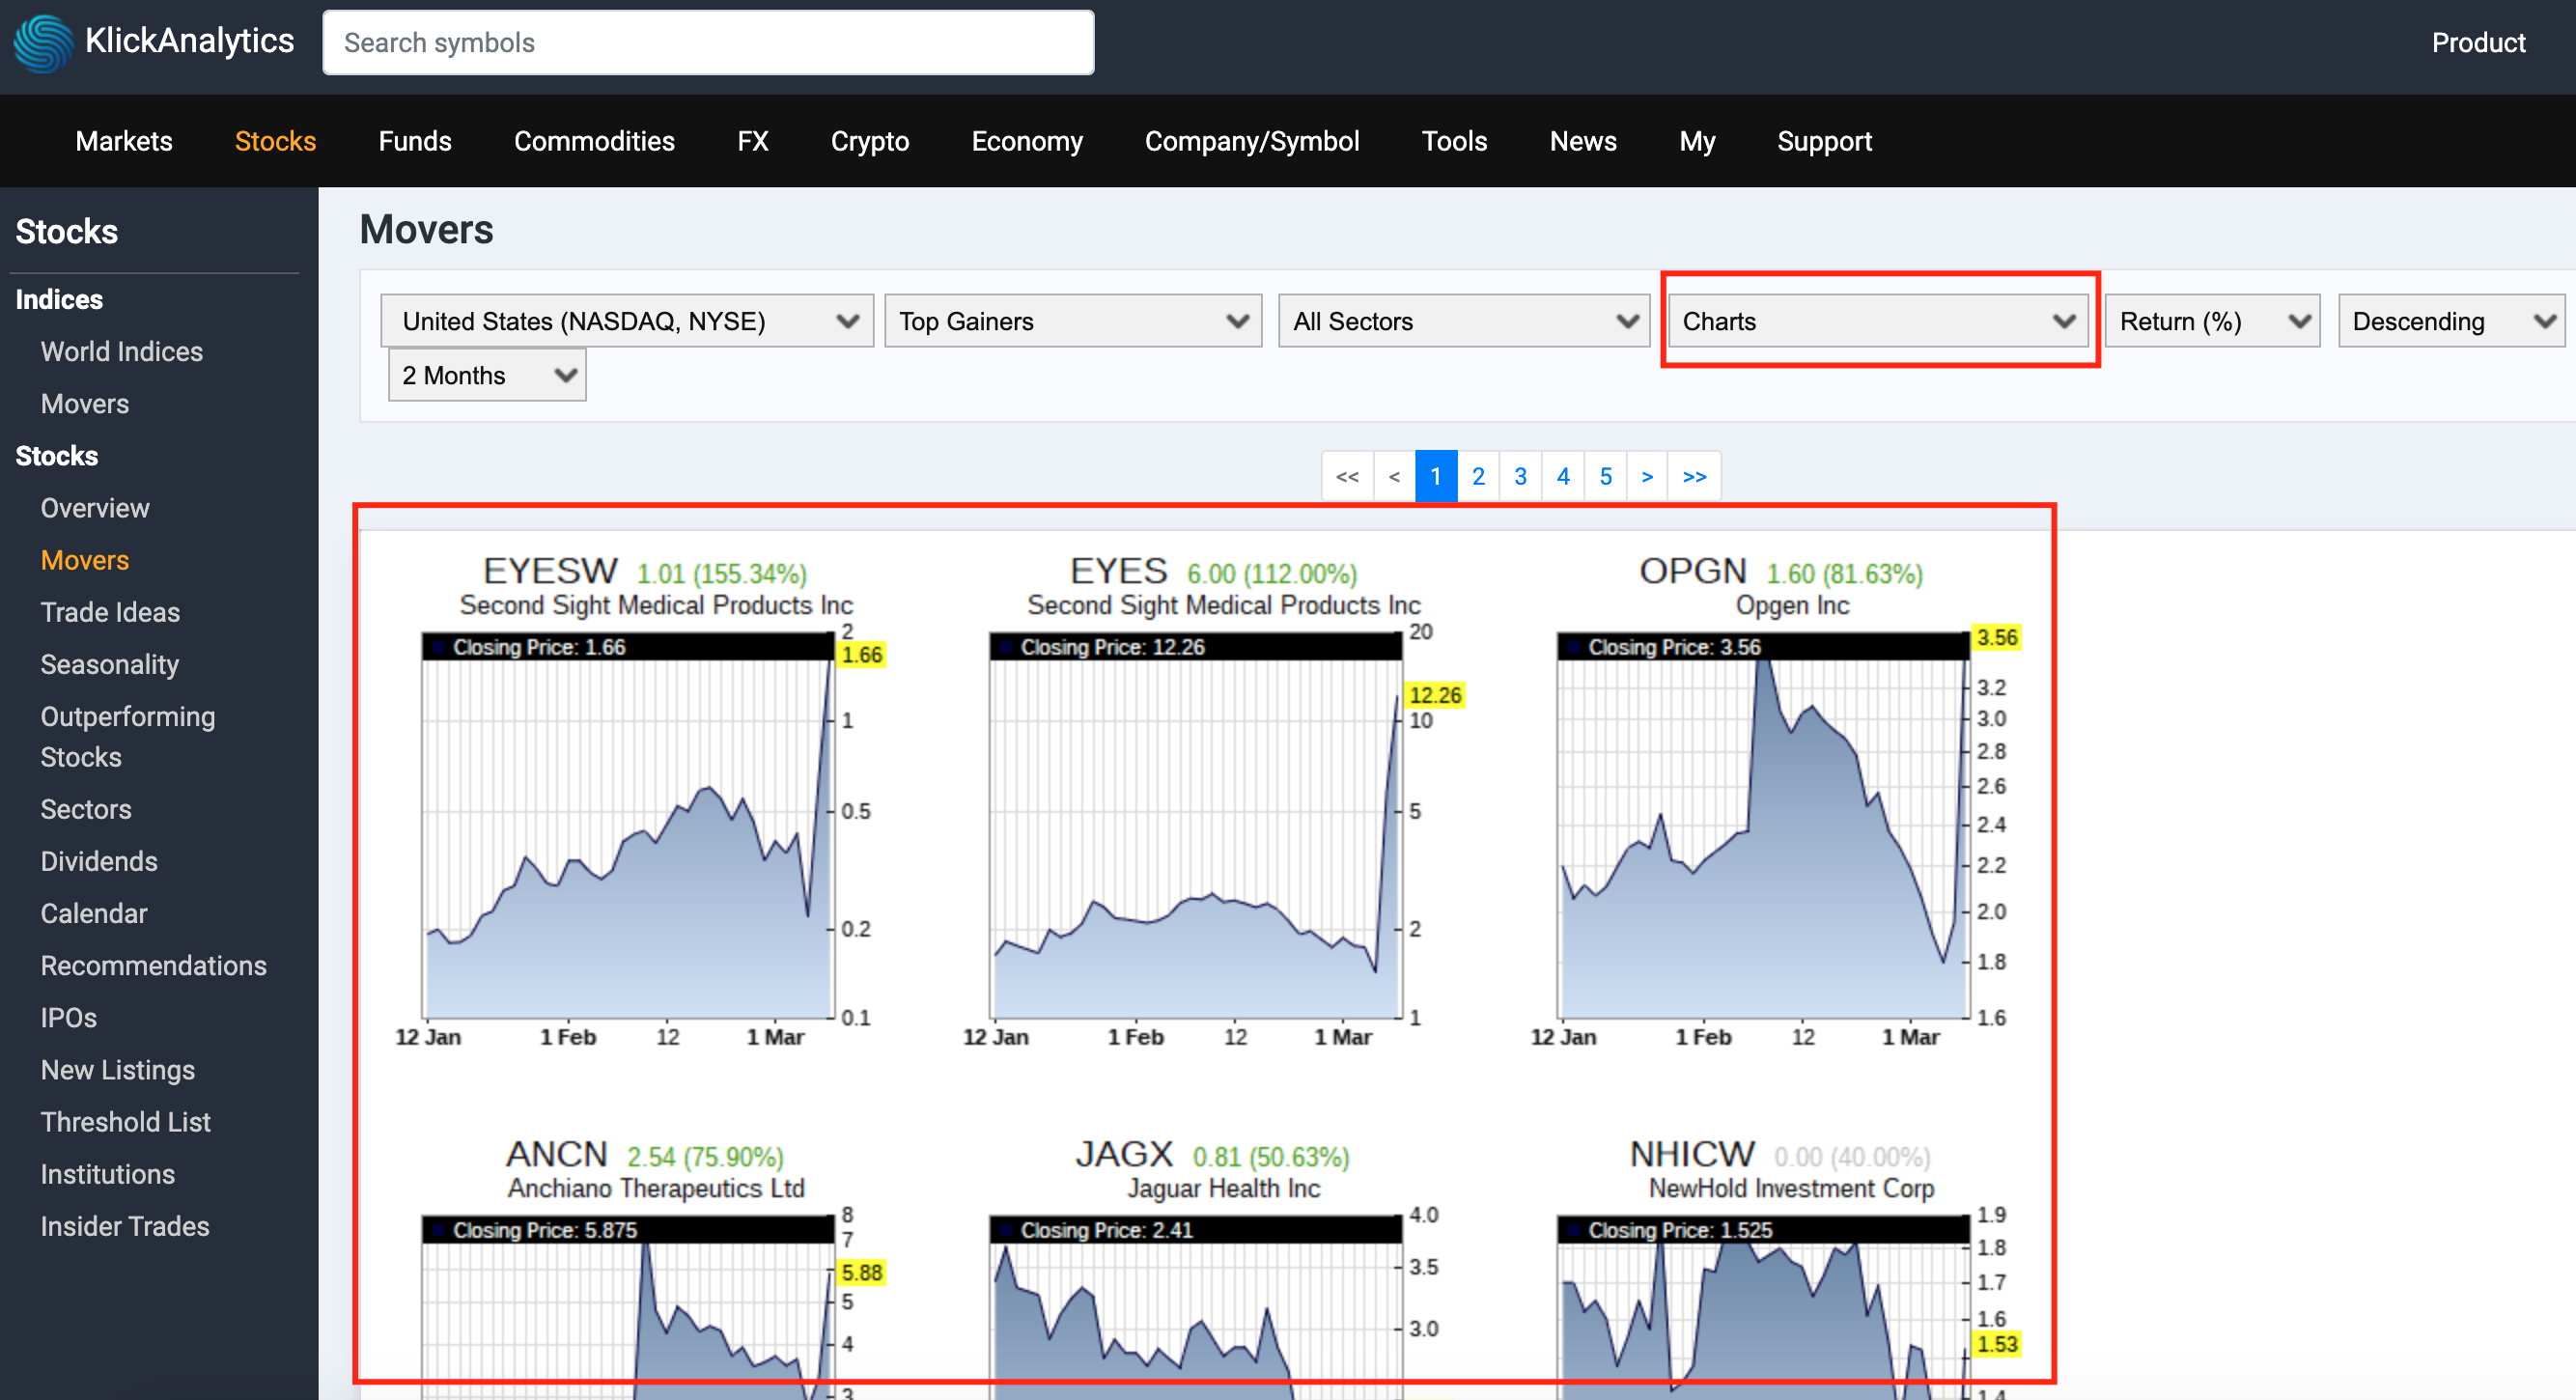
Turn data into Visualization with Charts and much more. We've made enhancements to all the table to turn data into visual charts and more. This will allow our users to;
View symbols in Visualization with
Mini Charts
Mini Charts will display data in mini charts with historical prices and the ability to sort them based on
Charts - Candle
Allows to show data in candle chart format
Charts - Technical
Ability to quickly see technical indicators plotted on your list of symbols with Simple Moving Averages and more
Charts - Interactive
Browse data interactively with charts - interactive
All visualization data can be sorted based on
Returns (%), Day Change ($), Volume, Symbols


Now you can visually check the entire market in charts and more. This feature is enable on all our tables.
To access: From top top menu, select Stock > Movers, and then click on Main Drop Down

