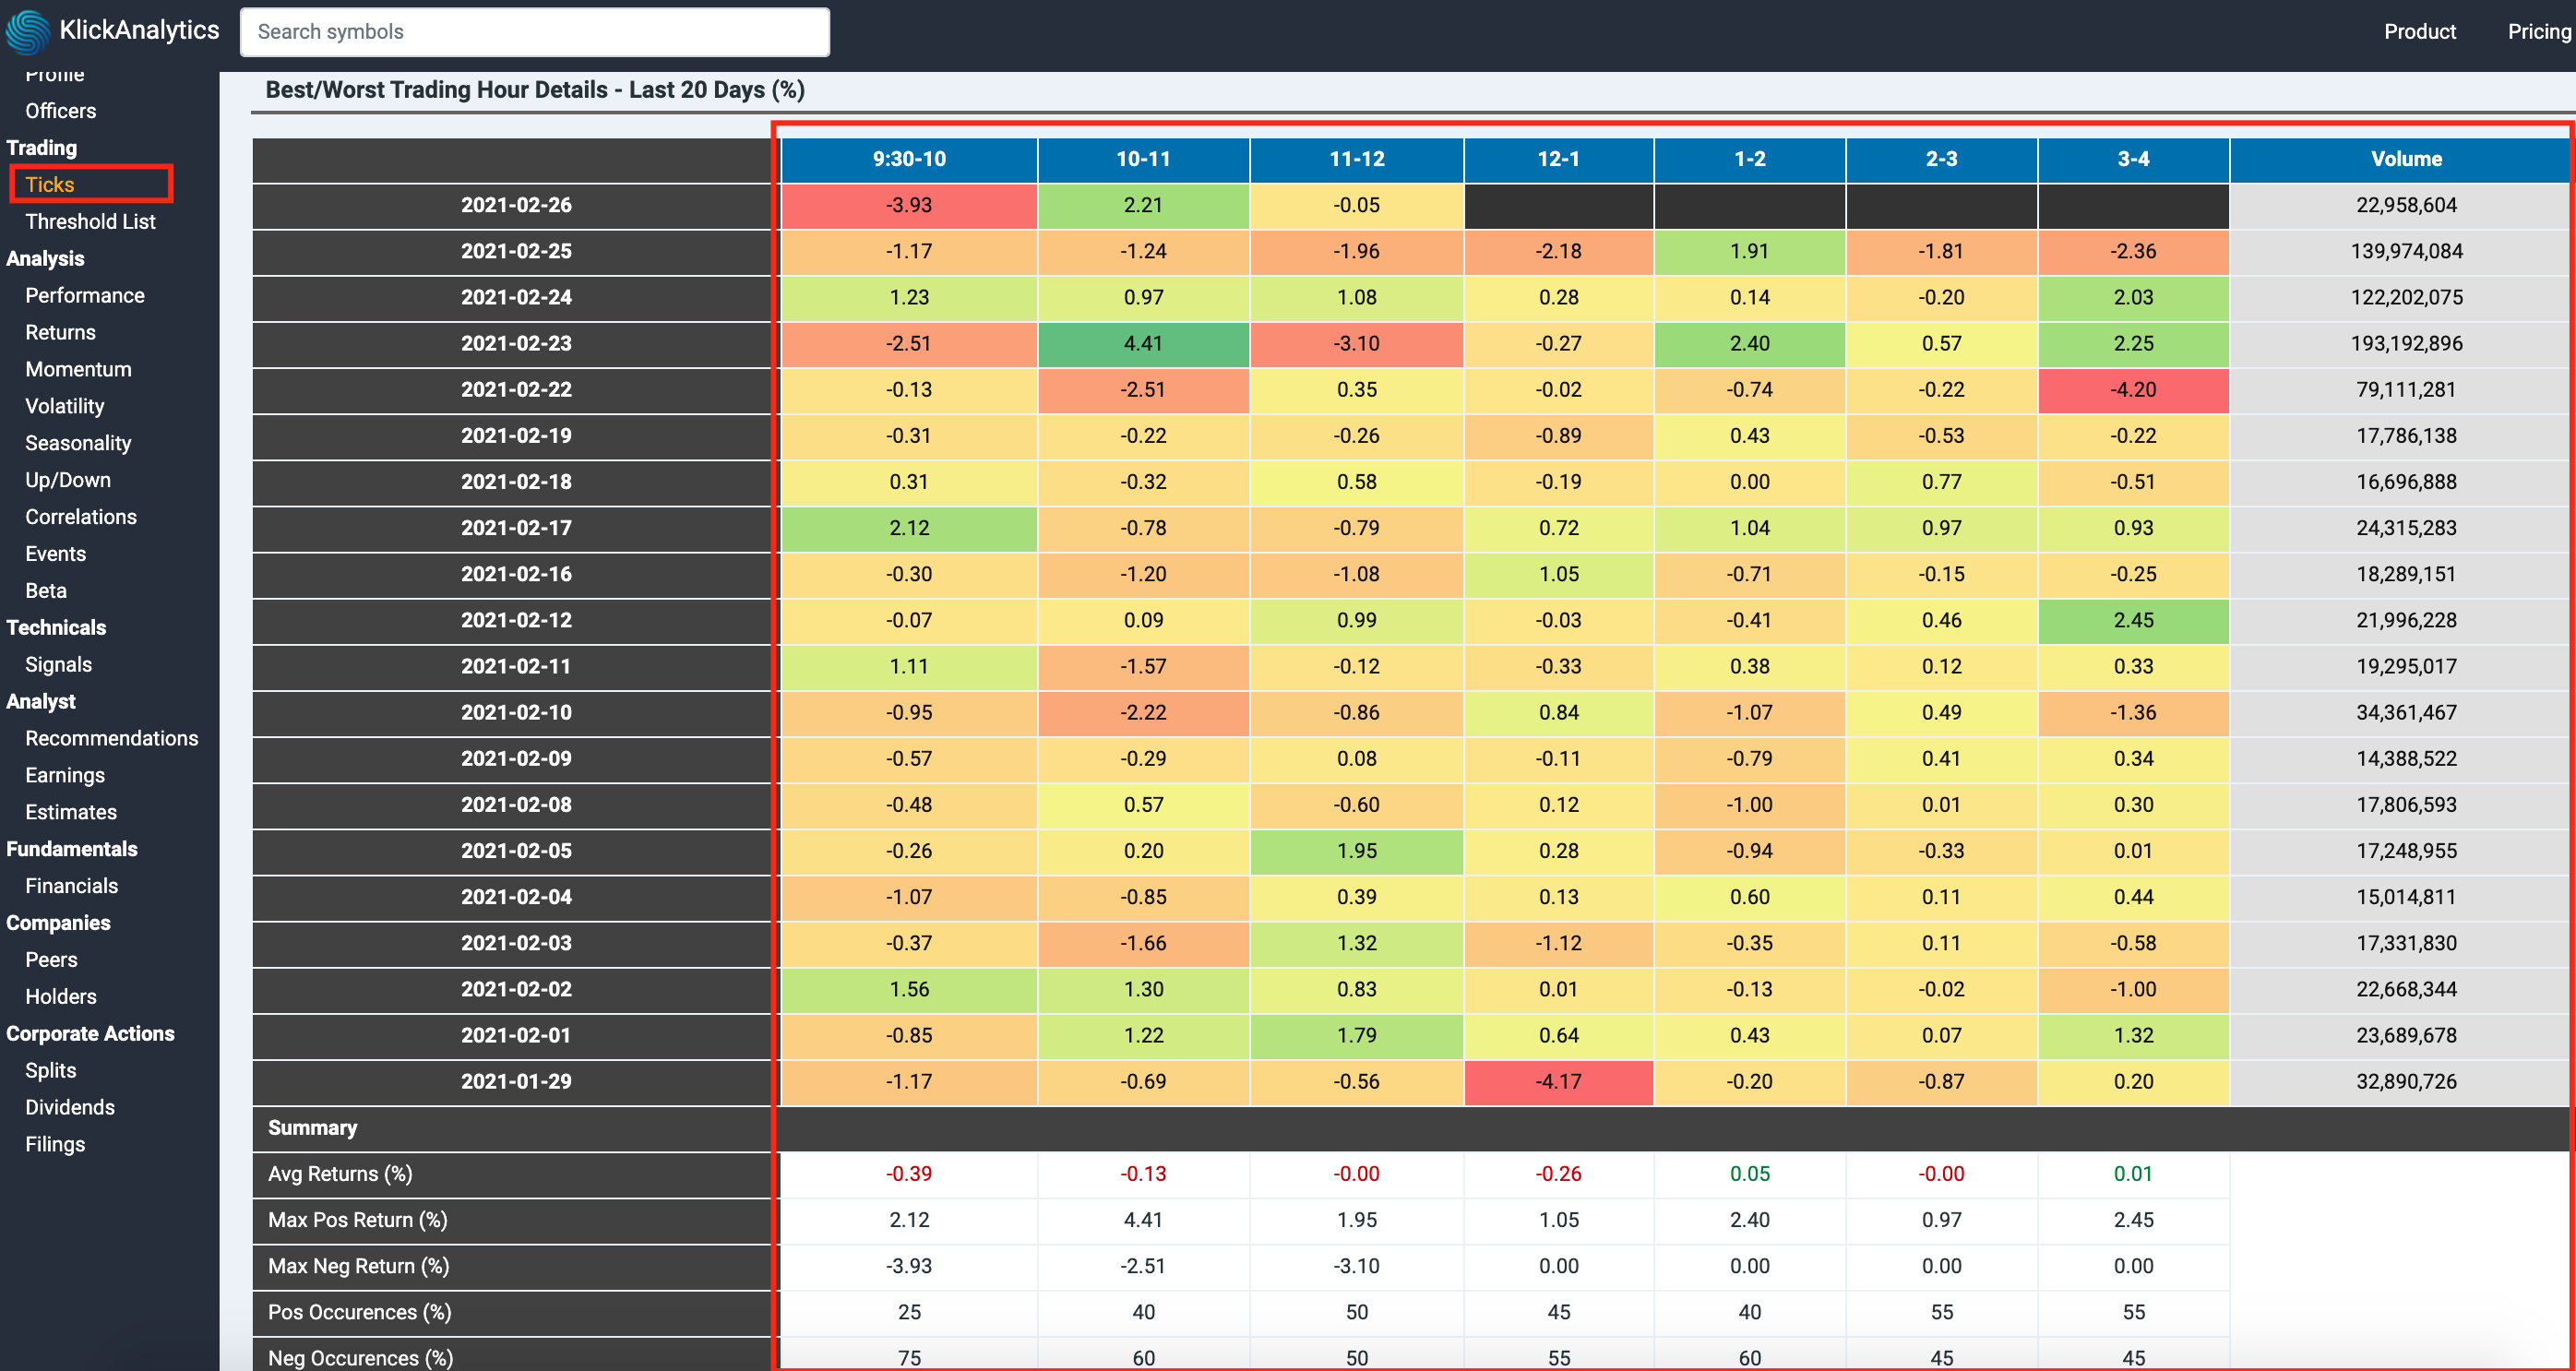
We've added the 1min historical tick data for all US listed companies. With this, we've create a new app which will allow our users to view historical price performance trends on 1min interval prices i.e.
Ability to analyze last 20 days of 1min interval price and volume data
Hourly analysis of price performance from 9:30am - 4:00pm EST
View hourly price performance within each trading hours
Total volume traded by date
Summary information for each trading hours with
Average returns
Max positive returns
Max negative returns
% of positive occurrences
% of negative occurrences

To access: Search for a US company say AAPL, and then from the left symbol menu, select ticks

