Beta is a measure of a stock's volatility in relation to the overall market. By definition, the market, such as the S&P 500 Index, has a beta of 1.0, and individual stocks are ranked according to how much they deviate from the market.
An instrument such as stock that swings more than the market over time has a beta above 1.0. If a stock moves less than the market, the stock's beta is less than 1.0. High-beta stocks are supposed to be riskier but provide higher return potential; low-beta stocks pose less risk but also lower returns.
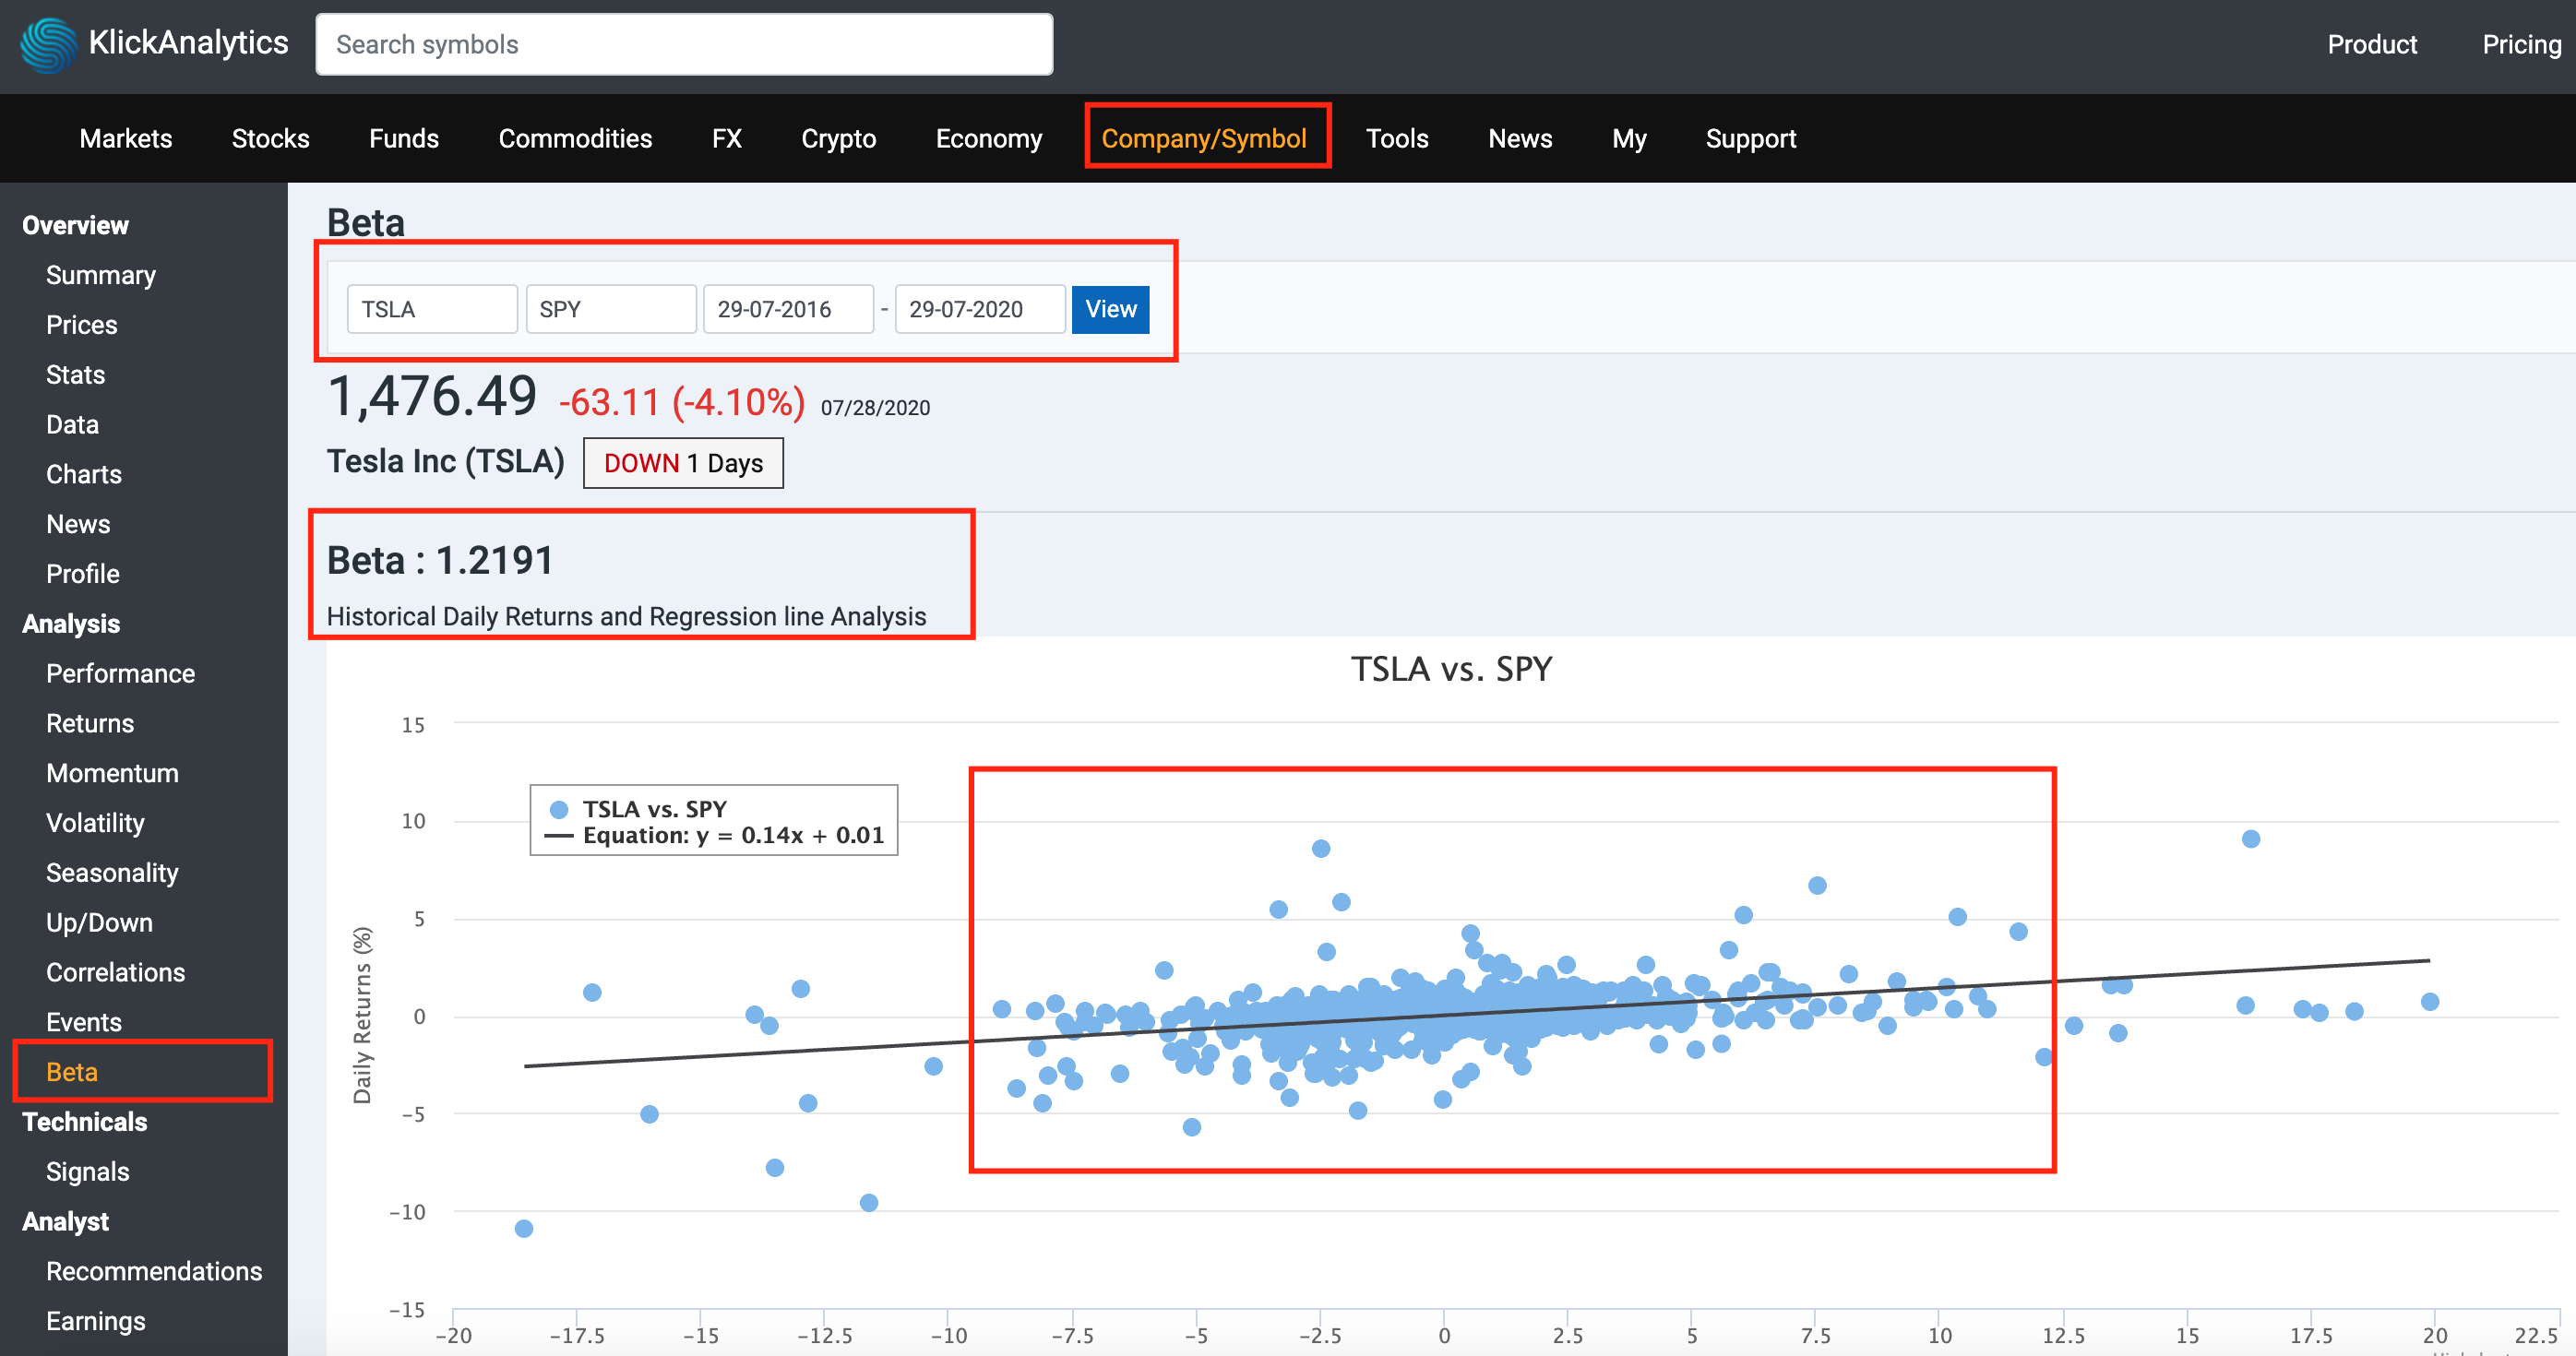
As Beta is so important to look at trend analysis, we've added a new app called Beta, where our users will be able to;
Calculate Beta given a historical date range
Able to set any benchmark index or even compare with any global stocks, ETFs, Commodities, and other any instruments
View the historical scatter chart with daily returns (%)
View the regression line to the analysis of two separate variables to define a single relationship

To access: Search for a symbol say TSLA, and then from the left symbol menu, select Beta

